In the previous article we covered how to identify processes, monitor resource usage, and check whether a service is running. That lets you spot when something is wrong — but there’s still a critical piece missing: understanding why.
When an application refuses to start, a service crashes, the system takes forever to respond, or a user can’t authenticate, Linux almost always leaves useful clues behind. Those clues live in logs: records that capture events, warnings, errors, and system messages over time.
The good news is that you don’t need to know dozens of tools or memorize every system path to make the most of them. If you understand how to query the journal, which key files tend to live in /var/log, and how to follow messages in real time, you already have a solid foundation for diagnosing a wide range of everyday problems.
What logs are and why they matter
A log is, at its core, a chronological record of events. Every time the system, a service, or an application wants to note something worth keeping, it writes it there: a successful startup, a warning, an error, an access attempt, a hardware fault.
The interesting part isn’t the definition — it’s the practical value. Logs turn a vague “it’s not working” into a concrete sequence of facts. They let you answer questions like:
- Which service actually failed?
- When did the problem start?
- Was it a permissions issue, a configuration error, or a network problem?
- Did the kernel detect something wrong with the disk, memory, or a driver?
- Were there failed authentication attempts?
Without logs, troubleshooting starts to feel a lot like guessing. With logs, you can reconstruct what the system was actually doing.
One more thing worth accepting early on: not all logs are the same. Some describe the system in general, others focus on the kernel, others track authentication, and others belong to specific services like Nginx, PostgreSQL, or Docker. You don’t need to master all of them at once — but you do need a rough mental map of where to start.
The basic mental map of logging in Linux
One reason logging can feel confusing at first is that there’s no single universal component that works identically across all distributions. The good news is that you don’t need to memorize the full archaeology of the ecosystem.
Think of it this way:
- On most modern distributions,
systemd-journaldcollects events from the system and from services managed bysystemd. - On many systems,
rsyslogor something similar also writes part of those events to files inside/var/log. - Some applications write their own logs directly to specific files.
- The kernel generates its own messages, accessible via
dmesg, which also tend to show up in the journal.
That’s the model that matters. You don’t need to memorize a fixed list of paths, because it varies by distribution, version, and what’s installed.
The core idea to hold onto is this:
Processes and services tell you what’s broken; logs help you understand why.
With that framing, everything else starts to fall into place.
Where to look first: the most important logs
When you don’t yet know where the problem is, having too many options can be paralyzing. It’s worth narrowing the field to a few sources that cover the vast majority of everyday issues.
journald and journalctl
On modern systems running systemd, journalctl is usually the first tool to reach for. It’s particularly useful for:
- viewing recent system events;
- inspecting services managed by
systemd; - reviewing messages from the current boot;
- filtering by severity, unit, or time range.
If a service is failing and it’s under systemd, this is typically where you’ll find the answer.
/var/log/syslog or /var/log/messages
Depending on the distribution, you might find /var/log/syslog (common on Debian and Ubuntu), /var/log/messages (common on Red Hat, Fedora, or AlmaLinux), or both. These are general system logs that give you a broad view of activity when you’re not yet focused on a specific component.
Don’t obsess over the exact filename. The important thing is that there’s usually some “general activity” file maintained by the classic logging system.
/var/log/auth.log or /var/log/secure
This is where authentication-related events tend to show up:
- login sessions;
sudousage;- SSH access;
- failed login attempts.
If the problem is related to permissions, remote access, or credentials, this file is worth a close look. On Debian/Ubuntu systems it’s called auth.log; on Red Hat and derivatives, secure.
dmesg and kernel messages
Kernel messages are especially valuable when you suspect:
- hardware issues (disks, memory, network);
- driver problems;
- something going wrong during boot.
dmesg gives you fast access to that layer of the system. In many environments, some of those messages also appear in the journal.
Service-specific logs
Many services maintain their own log files. Some common examples:
- Nginx:
/var/log/nginx/ - Apache:
/var/log/apache2/ - PostgreSQL: varies by distribution and configuration
- Docker: combined with
journalctlor the container’s own logs
The key idea here is to not search blindly. If the service is managed by systemd, start with journalctl -u servicename. If it also has its own log directory, use that as a second level of detail.
A quick mental shortcut can save a lot of time:
- Service failing? →
journalctl -u servicename - Boot issues or hardware problems? →
dmesgorjournalctl -k - Access or authentication issues? →
auth.logorsecure - Need a system-wide view? →
journalctlorsyslog/messages
How to read logs without losing your mind
One of the most common mistakes is opening a huge log file and hoping the answer will just appear. That almost never works. The key is filtering.
Starting with journalctl
Without any options, journalctl dumps a massive amount of historical messages:
journalctl
That can be useful for a broad overview, but it’s rarely the best starting point. It almost always makes more sense to narrow things down from the start.
By boot:
journalctl -b
Shows messages from the current boot. Very useful when the problem appeared after a restart.
By service or unit:
    journalctl -u nginx
    journalctl -u ssh
Filters by systemd unit. If you know which service is misbehaving, this cuts through the noise significantly. It’s probably the combination you’ll use most often.
In real time:
journalctl -f
Follows the log in real time, similar to tail -f. Especially useful when you’re about to reproduce a problem and want to see what comes up right as it happens.
By severity:
journalctl -p err..alert
Filters by priority level, showing errors and more critical conditions. Significantly reduces output volume on busy systems.
By time:
    journalctl --since "1 hour ago"
    journalctl --since "2026-05-31 10:00:00" --until "2026-05-31 11:00:00"
Limits output by time window. Particularly useful when you have a rough idea of when the incident occurred. You can combine this with -u to narrow things down even further.
The goal isn’t to memorize every option — it’s to get comfortable thinking in terms of filters: by boot, by service, by severity, or by time.
Browsing classic log files
When working with files inside /var/log, three simple tools cover almost everything:
    tail -f /var/log/syslog
    less /var/log/auth.log
    grep -i error /var/log/syslog
tail -ffollows the file in real time.lesslets you browse at your own pace without dumping everything to the screen at once. Search with/termand quit withq.grephelps you find quick patterns likeerror,failed,denied, or a service name.
A very handy combination when the file is large and you’re looking for something specific:
grep -i "failed\|error\|denied" /var/log/auth.log | tail -30
This filters for multiple patterns at once and limits the output to the last 30 matches.
Checking kernel messages
For events related to the kernel and hardware:
    dmesg | less
    dmesg --level=err,warn
    dmesg -T
--level=err,warn filters down to the most relevant messages and cuts out a lot of the normal system noise. -T shows timestamps in a human-readable format (date and time) instead of time elapsed since boot, which makes it much easier to correlate events with other logs.
Practical example: a 403 Forbidden caused by file permissions in Nginx
Nginx is up and running without issues, but users hitting a specific URL are getting a 403 Forbidden error. The file exists on the server, but its permissions are too restrictive:
    ls -l /usr/share/nginx/html/private.html
    -rw------- 1 root root 18 Jun  2 10:00 private.html
The first step is to confirm the service’s state:
systemctl status nginx
It shows as active with no startup errors, which rules out a global configuration failure. The problem is in how it handles that specific request. The next step is to follow the error log in real time while reproducing the failure from another terminal:
tail -f /var/log/nginx/error.log
The log shows the cause immediately:
2026/06/01 12:30:10 [error] open() "/usr/share/nginx/html/private.html" failed (13: Permission denied), client: ...
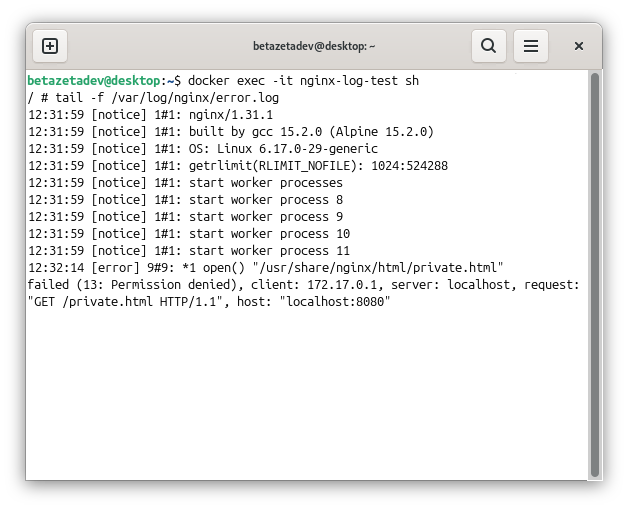
The Nginx process — which on Debian typically runs as www-data — has no read access to the file. Permissions set to 600 only allow the owner to read it. The fix is straightforward:
chmod 644 /usr/share/nginx/html/private.html
And the request goes through. The full flow:
systemctl status nginxruled out a general service failure.tail -f /var/log/nginx/error.logcaptured the exact error the moment it occurred.- The
13: Permission deniedcode pointed directly to the cause. - A
chmod 644fixed it.
There’s an important nuance here: systemctl status nginx reports the service as healthy, which might make you think everything is fine. It’s the logs that reveal the problem is happening at the individual request level, not the service level. That distinction is the difference between looking for the fault in the wrong place and finding it quickly where it actually is.
The same logic applies to the tools from the previous article. If you suspect a port conflict, check with ss. If you suspect resource exhaustion, look at memory or disk. Logs don’t replace those tools — they make them far more useful.
How to keep log growth under control
Logs are valuable, but they also grow. If they grow unchecked, they can take up significant disk space — especially on servers with heavy traffic or very verbose services.
The right mindset here is: logs aren’t something you delete randomly — they’re something you manage. That’s what logrotate is for on most Linux systems.
What logrotate does
logrotate applies automatic policies to log files:
- rotates files when they reach a certain size or age;
- compresses old logs to save space;
- keeps a limited number of historical copies;
- removes the oldest history according to defined rules.
You can inspect the general configuration and service-specific rules like this:
    ls /etc/logrotate.d/
    cat /etc/logrotate.d/nginx
And before making any changes, you can do a dry run to see what would happen without actually executing anything:
logrotate --debug /etc/logrotate.conf
The --debug flag shows you what logrotate would do without actually running it. A highly recommended practice before touching any configuration in production.
Managing journal size
If the system uses journald, you can check how much disk space it’s currently using:
journalctl --disk-usage
And if you need to trim it, you can do so with some precision:
    journalctl --vacuum-time=7d
    journalctl --vacuum-size=500M
--vacuum-time=7d removes entries older than seven days. --vacuum-size=500M trims total storage down to that limit.
Be particularly careful in production environments. Clearing logs without thinking it through can leave you without the information you need to investigate a serious incident. Before cleaning anything, it’s worth understanding why they’re growing: high traffic, errors looping repeatedly, overly verbose service configuration, or simply a retention policy that was never tuned.
Good practice isn’t “delete it because it’s annoying” — it’s “adjust it because you understand the cost and value of that data.”
Good practices for working with logs
None of this needs to be complicated. These habits make more of a difference than learning twenty new commands:
- Don’t just look at the last line: look for context before and after the error. The root cause is usually a few messages up.
- Filter by time, service, or level to cut through the noise from the start.
- If you’re investigating something live, use
tail -forjournalctl -f. - If the problem happened during boot, start with
journalctl -b. - If the service is under
systemd, usejournalctl -ubefore hunting through files blindly. - Don’t delete logs without first understanding why they’re growing.
- Combine logs with tools like
systemctl status,ps,ss,df, orfreeto complete the picture.
And there’s one idea that’s especially worth internalizing if you’re coming from other environments: an isolated error rarely tells the whole story. The useful clue is often not in the exact failure line, but in what happened just before it. Reading logs isn’t about finding the red line — it’s about reconstructing a sequence.
Conclusion
Understanding logs is one of the most important steps toward stopping flying blind in Linux. Processes, services, and resource metrics help you detect that something’s wrong; system logs help you reconstruct what happened, when it happened, and which component was involved.
And the best part is that you don’t need to master the entire observability ecosystem to get started. With journalctl, a few key files inside /var/log, dmesg, and a basic understanding of log rotation, you can move with much more confidence — whether you’re on a desktop machine or a server.
When you understand what’s happening in a system, you actually start to control it.
Happy Hacking!!