In the previous articles of this series, we covered the fundamentals of Linux, how the system is organized and user management, how permissions work, and several commands to work more efficiently. All of that helps you understand Linux “at rest”: its files, its users, and its rules.
Now it’s time to look at Linux in motion. A GNU/Linux system is always running tasks, distributing resources, and keeping services alive in the background. Many everyday problems start right here: an application freezes, a build process consumes all the CPU, the machine runs out of memory, or a service stops responding.
The good news is that you don’t need dozens of tools to understand what’s going on. With a handful of well-chosen commands, you can answer four key questions: what is running, what is consuming resources, how to step in without breaking anything, and how to check whether a system service is functioning properly.
What is a process in Linux
A process is simply a running program. When you open your browser, launch an editor, or run a script from the terminal, Linux creates one or more processes to handle that work.
Every process has a unique identifier called a PID (Process ID). That number matters because many tools rely on it to query information or send instructions to a specific process.
There are also four key ideas worth keeping in mind:
- A process can create other processes — that’s why we talk about parent and child processes.
- Every process belongs to a user, just like files have an owner.
- Some processes run in the foreground, meaning they’re connected to your current terminal.
- Others run in the background, doing their work without blocking your session.
Not every process is a service. A process can be something short-lived, like vim or python script.py. A service, on the other hand, is usually a process — or a group of processes — designed to stay running and provide some function to the system or the network, like ssh, nginx, or docker.
How to see running processes
When you want to know what the system is doing, the usual starting point is ps. Think of it as a snapshot of the current state.
ps
This shows processes tied to your terminal. Useful, but you’ll usually want a broader view:
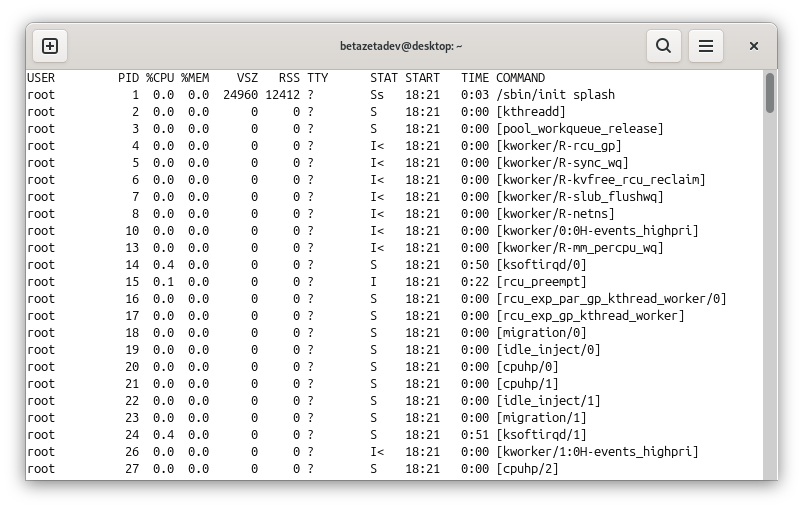
    ps aux
    ps -ef
Both commands display virtually all processes on the system. You don’t need to memorize every column, but it helps to recognize the most important ones:
USER: the owner of the process.PID: the process identifier.%CPUand%MEM: approximate CPU and memory usage.STAT: process state.COMMANDorCMD: the command that started it.
If you’re looking for something specific, filtering is the way to go:
    ps aux | grep firefox
    ps -ef | grep nginx
This works fine, though Linux has more direct tools for finding processes by name:
    pgrep firefox
    pgrep -a python
    pidof sshd
pgrep returns PIDs matching a pattern; add -a to also see the full command. pidof is handy when you want the PID of a very specific binary.
Practical examples:
    # Check if your browser is still open
    pgrep -a firefox

    # Locate the Nginx web server
    ps -ef | grep nginx

    # Find the PID of a running script
    pgrep -a -f "python backup.py"
The key habit here isn’t memorizing column names — it’s learning to quickly find which process you care about and who’s running it.
Real-time monitoring with top and htop
ps gives you a snapshot. If the system feels slow and you want to watch the load evolve live, you need continuous monitoring.
top
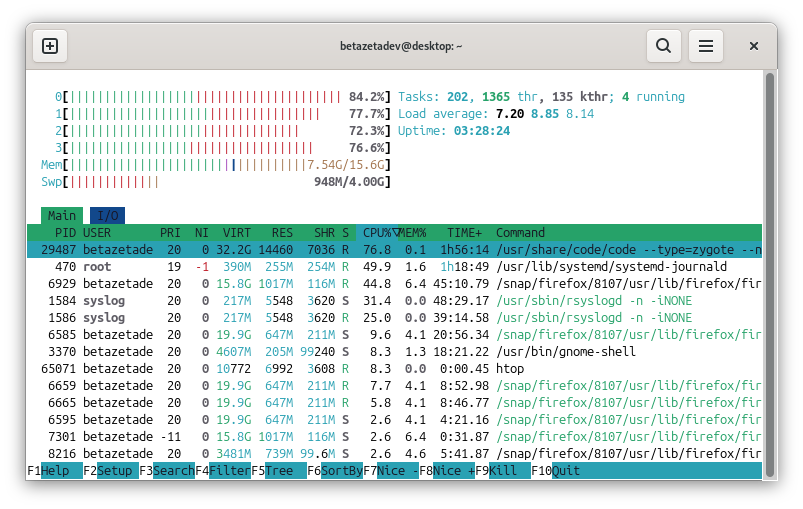
top refreshes its output every few seconds and makes it very clear which processes are consuming the most CPU or memory. If you have htop installed, the experience is usually more comfortable:
htop
htop doesn’t always come pre-installed, but it’s worth adding. It’s more visual, lets you navigate with the keyboard, and makes sorting processes much easier.
When you open top or htop, focus on these things:
- CPU: if one or two processes are maxing it out, you’ve likely found the bottleneck.
- RAM: if very little is available, the system will start to struggle.
- Swap: heavy swap usage usually signals memory pressure.
- Load average: summarizes the average system load over the last 1, 5, and 15 minutes.
Load average isn’t exactly the same as CPU usage. It measures how many processes are running or waiting to run. You can have a CPU that isn’t fully saturated and still see a high load average if many tasks are competing for resources or blocked waiting on disk.
Two typical scenarios:
    # Watch live which process is spiking the CPU
    top

    # Use a more comfortable view if htop is available
    htop
- If a process stays at the top with a very high
%CPU, that’s where the problem is. - If free RAM drops and swap starts growing, the system is likely paging — moving memory between RAM and disk because there’s not enough physical memory left.
- If the load average stays high for a sustained period, the slowness is probably system-wide rather than caused by a single application.
When a machine starts acting strange, this is usually the first useful stop.
How to handle processes without going nuclear
Once you’ve tracked down the problematic process, comes the delicate part: stepping in without causing more damage than necessary.
The basic command is kill, even though the name is a bit misleading. It doesn’t always terminate a process immediately — it actually sends a signal.
kill 12345
With no extra flags, kill sends SIGTERM, a signal asking the process to shut down gracefully. This is always the first choice, because it gives the process a chance to close files, release resources, or save its state.
You can also target by name:
    pkill firefox
    killall node
The most useful signals in everyday work are:
SIGTERM: a polite request to shut down cleanly.SIGKILL: an immediate, forced termination.SIGSTOP: pauses the process.SIGCONT: resumes a paused process.
Practical examples:
    # Ask a frozen application to close cleanly
    kill 12345

    # If it doesn't respond, force it as a last resort
    kill -9 12345

    # Stop all processes of a script by name
    pkill -f "python backup.py"

    # Temporarily pause and resume a process
    kill -STOP 12345
    kill -CONT 12345
kill -9 is equivalent to SIGKILL and shouldn’t be your first instinct. Forcing a hard kill too soon can leave files half-written, sockets open, or the application in an inconsistent state. Try SIGTERM first, and only escalate if the process genuinely won’t respond.
Foreground, background and job control
One of the most practical terminal skills is understanding the difference between running something up front versus letting it work in the background.
If you run a regular command, it stays in the foreground and blocks the terminal until it finishes:
python long_script.py
If you know from the start that you want to keep using the terminal, send it to the background with &:
python long_script.py &
To see the jobs associated with your current session:
jobs
And to move them between foreground and background:
    bg %1
    fg %1
A very common flow looks like this:
    # Start a long task
    python long_script.py

    # Suspend it with Ctrl+Z and send it to the background
    bg

    # Bring it back later
    fg
If the task needs to keep running even after you close the terminal, use nohup:
nohup python long_script.py > output.log 2>&1 &
This is especially useful for exports, backups, or scripts that will take a while and that you don’t want to lose when closing an SSH session.
Process priority with nice and renice
Not all processes need to compete on equal footing. Linux lets you adjust priority so that a heavy task doesn’t drag down everything else.
With nice, you can launch a process at a lower priority:
nice -n 10 make -j8
The higher the nice value, the lower the priority. This is great for builds, video conversions, or any intensive task that can afford to wait a bit.
If the process is already running, you can change its priority on the fly with renice:
renice 10 -p 12345
Real-world example:
    # Run an intensive build without hammering your desktop
    nice -n 10 npm run build
In some environments, an administrator might want to give a critical process higher priority — but that usually requires elevated permissions and should be done carefully. In most day-to-day scenarios, knowing how to lower the priority of a heavy task so it doesn’t ruin your session is what really matters.
Monitoring memory, disk, and system load
Not every performance problem shows up when you look at individual processes. Sometimes you need a quick overall picture of how the system is doing.
Memory
free -h
This shows used RAM, available RAM, cache, and swap. The most useful column today is usually available, because Linux uses free memory as cache — and that doesn’t necessarily mean there’s a problem.
If available memory is low and swap is growing, the system may start responding very slowly.
Disk
    df -h
    du -sh ~/Downloads
df -h shows total and free space per filesystem. du -sh tells you how much a specific directory is using.
The distinction matters:
df -hanswers “how much disk space is left”.du -shanswers “how much does this path take up”.
Load average
uptime
In addition to showing how long the system has been running, uptime displays the load average. It’s a quick way to check whether the machine has been working harder than usual for a while.
With these tools, you can build a fairly solid initial diagnosis:
- If RAM looks tight, check
free -h. - If you suspect disk space issues, start with
df -hthen drill down withdu -sh. - If the system feels generally slow, check
uptimeand compare it with what you see intop.
What is a service in GNU/Linux
A service is a process — or a group of processes — that typically runs in the background to provide some function to the system or to other machines on the network.
For example:
sshenables remote connections.nginxserves web content.cronschedules periodic tasks.dockermanages containers.
You’ll often hear the term daemon as well. In practice, it refers to those background processes that stay alive waiting for work to come in.
On most modern distributions, these services are managed by systemd, and the main tool for that is systemctl.
Basic service management with systemctl
If you suspect a service isn’t working, start by checking its status:
    systemctl status ssh
    systemctl status nginx
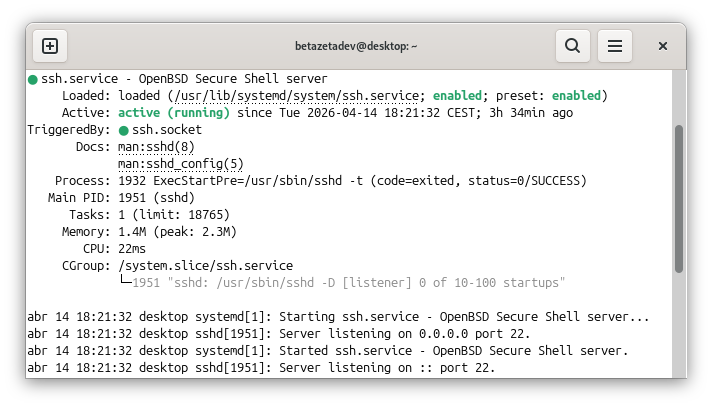
That gives you the essential information about the service’s state. From there, you can start, stop, or restart it:
    sudo systemctl start nginx
    sudo systemctl stop nginx
    sudo systemctl restart nginx
You can also decide whether it should start automatically with the system:
    sudo systemctl enable docker
    sudo systemctl disable docker
There’s an important difference here:
systemctl startstarts the service right now.systemctl enablemakes it start automatically on future boots.
They’re not the same. A service can be running but not enabled on startup, or enabled for future reboots but currently stopped.
Everyday examples:
    # Check if SSH is running
    systemctl status ssh

    # Restart Nginx after changing its configuration
    sudo systemctl restart nginx

    # Make Docker start with the system
    sudo systemctl enable docker
Killing a process and stopping a service are also not quite the same thing. If you kill the main process with kill, the service manager might just bring it back up again. If you want to manage a system service, you should do it through systemctl.
A practical troubleshooting workflow
With all these commands in hand, you can follow a fairly clear mental roadmap.
1. An application stops responding
    pgrep -a firefox
    top
    kill PID
    kill -9 PID
First locate it, then check whether it’s consuming resources abnormally, then try to close it gracefully. Only escalate to kill -9 if it refuses to respond.
2. The system is running slow
    top
    free -h
    uptime
Check whether the CPU is saturated, whether memory is low, or whether the load average has been high for a while. Once you identify the problematic process, you can terminate it or reduce its impact with renice.
3. A long task is blocking your terminal
    jobs
    bg
    fg
    nohup command &
If you already started it, you can suspend it and send it to the background. If it needs to survive past the session, relaunch it with nohup.
4. A service isn’t behaving as expected
    systemctl status nginx
    sudo systemctl restart nginx
    sudo systemctl enable nginx
Check its status, restart it if needed, and verify whether it’s set to start automatically. In a future article, we’ll go deeper into logs and system diagnostics with journald and other system logs — that’s where you’d continue if the problem persists.
Good practices to keep things sane
- Don’t reach for
kill -9right away — try a clean shutdown withSIGTERMfirst. - Always check which process you’re about to stop before doing it, especially if it’s running as
rootor belongs to the system. - Don’t run everything as root — in most cases you don’t need to; only use elevated privileges when strictly necessary.
- Know the difference between a user application and a service managed by
systemd. - Don’t confuse high CPU load with low memory — they’re different problems and they’re diagnosed differently.
- Before blindly restarting a service, check its status with
systemctl status.
Conclusion
Understanding processes, resources, and services is one of the most important steps toward moving from simply using Linux to actually controlling it. With a small set of well-chosen tools, you can inspect what’s running, measure its impact, step in safely, and keep core services under control.
This knowledge also applies equally to desktop and server environments. The context changes, but the questions are the same: what’s happening, what resource is short, and what’s the right way to act.
The natural next step in this series is to go deeper into logs and system diagnostics — learning not just that something failed, but why, and how to read the evidence the system leaves behind.
Happy Hacking!!