You open a free app, check something for a few seconds, and a banner appears at the bottom of the screen. You probably do not stop to think about everything that had to happen for that particular ad—and not another one—to appear in that exact place and moment.
From a developer’s perspective, the process does not look much more complicated at first. You integrate an ad SDK, make room in the interface, configure a few settings, and ads begin to appear. The first bit of revenue comes in, and it all seems fairly straightforward.
Behind that banner, however, is a market that operates continuously and makes decisions in milliseconds, with several companies involved in every advertising opportunity. That market determines which ad you see, what that view is worth, and ultimately how much revenue the app earns.
Who decides which ad appears? Why can two users of the same app generate completely different amounts of revenue? What does a €3 eCPM actually mean? What happens when an app requests an ad and none is available? Why do 100,000 requests not produce 100,000 impressions? And perhaps most importantly: do more ads necessarily mean more revenue?
This is the first article in a series on ad monetization. We will start with the fundamentals of how the market works, then move on to metrics, formats, mediation, experimentation, and the strategies that turn advertising into a source of revenue for apps, games, and other digital products.
You do not need any prior knowledge to follow along. If, by the end, you can open AdMob—or another ad platform—and understand what you are looking at instead of seeing an indecipherable wall of acronyms and percentages, this article will have done its job.
First things first: what does an app actually sell?
It is easy to think that an app “sells ads.” That is not quite right. What an app offers is a set of opportunities for third parties to show ads to its users. Together, those opportunities make up its ad inventory.
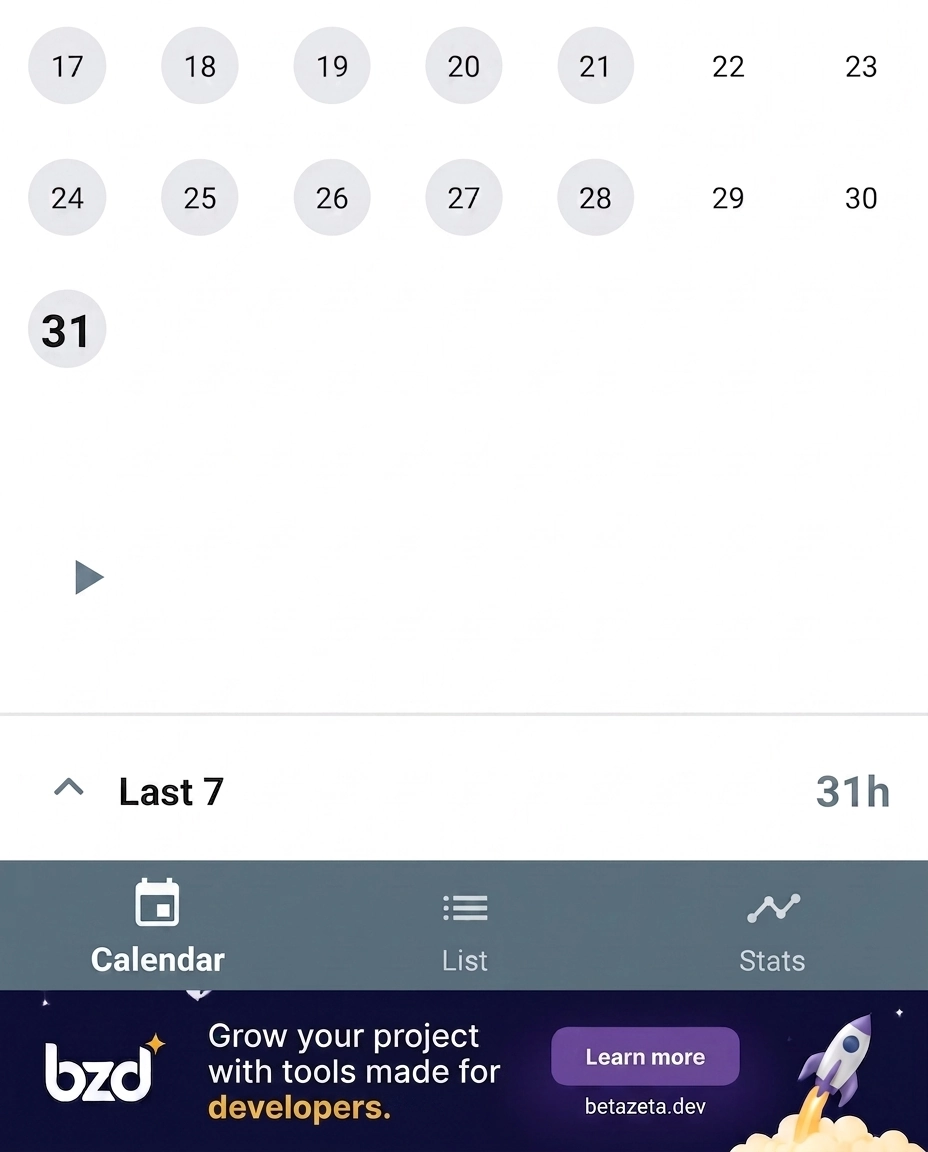
An available ad slot at a particular moment and in a particular context is a business opportunity. A weather app, for example, might have a fixed banner on its home screen and a native ad embedded in the weekly forecast. Those spaces—and every occasion on which a user might see them—are part of its ad inventory.
There are two ideas within that inventory that are worth separating from the outset, because people often blur the distinction in everyday conversation. Before giving them their technical names, consider an example that has nothing to do with apps.
Picture a roadside billboard. One part is the permanent structure: the empty frame where an ad can be displayed. The other is the particular poster hanging there today: it might advertise a bank this week and a supermarket next week, while the structure remains in the same place. The structure is the space; the poster is what occupies it at a given time. That is essentially the distinction between a placement and an ad unit.
A placement is the “billboard structure”: the place and moment within the app experience where an ad can appear. Examples include “the banner at the bottom of the statistics screen” or “the full-screen ad shown after a game level ends.” The description should let anyone on the team—not only a developer—understand which space is being discussed without looking at the code.
An ad unit is the technical configuration connected to that space. In practice, it is an identifier created in a platform such as AdMob and added to the app’s code so the app knows where to request an ad for a given placement. A placement may always use one ad unit, or it may use several when the team tests different formats or providers to find what performs best.
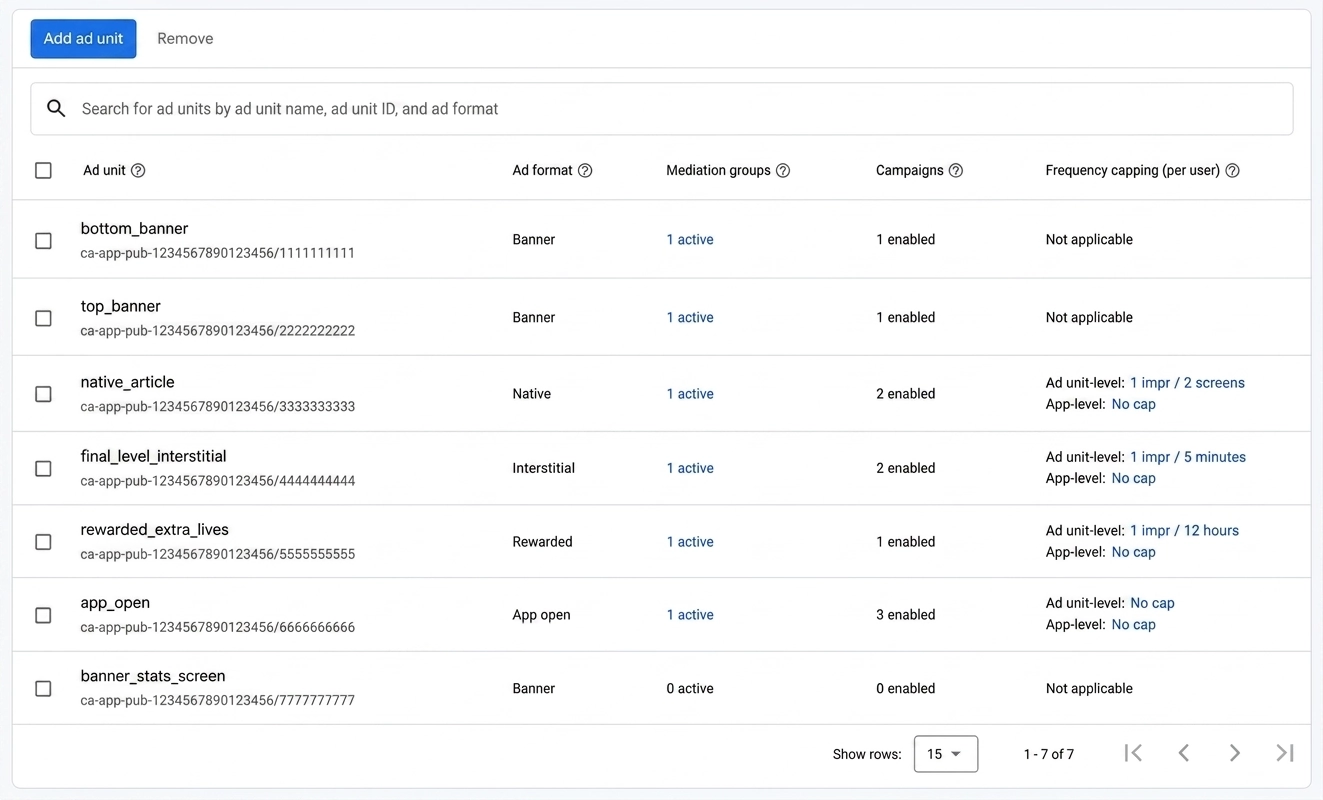
The key idea is one we will revisit throughout this article: having inventory available does not mean it will be sold, and selling it does not necessarily mean the ad will be shown. There is a complete process between creating the space, filling it, and displaying the ad. That process is what we will unpack next.
Who takes part in the advertising market?
Before going any further, it helps to name the participants in this market. In simplified terms, the relationship looks like this:
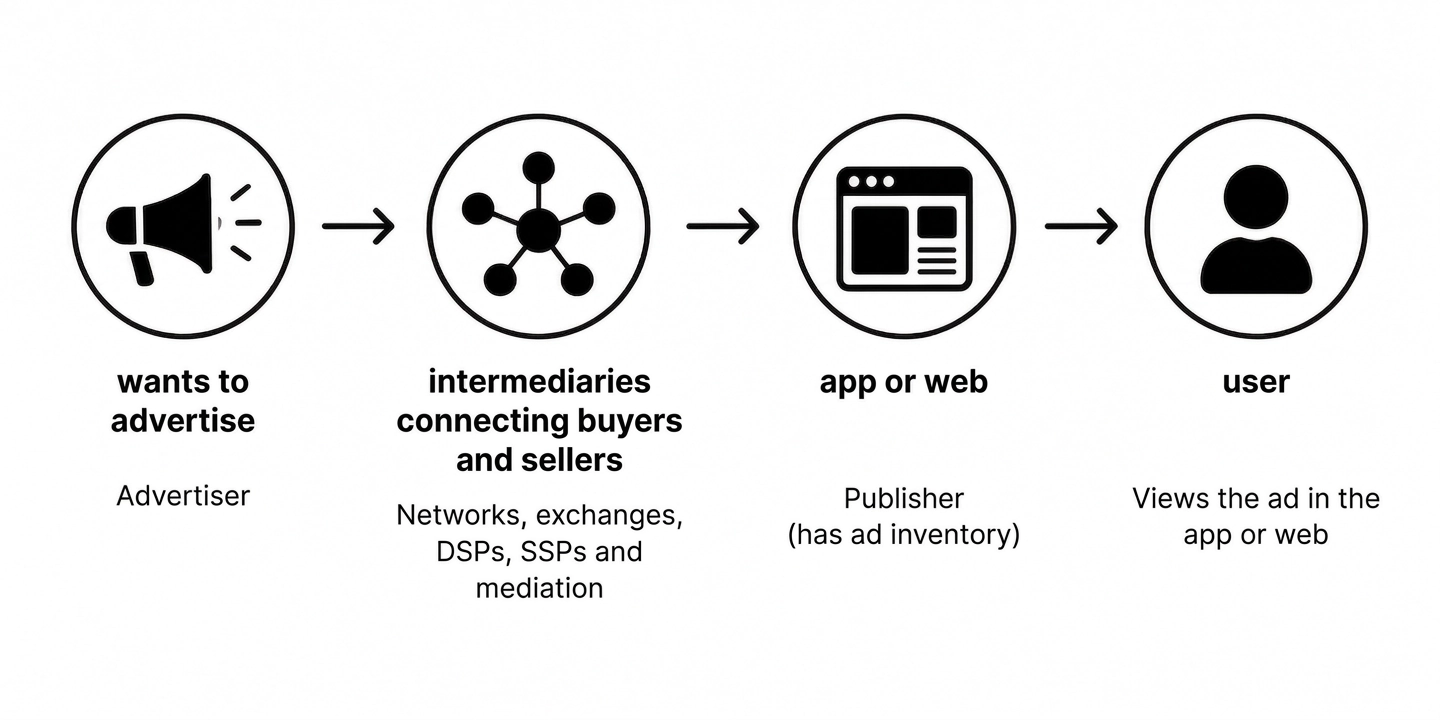
Each box also has its own industry term, so let us go through the main participants one by one.
An advertiser is a company or individual that wants to promote something and is willing to pay for it. It might be a bank promoting an account, a game studio looking for installs, or an online store trying to generate sales.
The publisher is us from the other side of the market: the owner of an app, website, or game with an audience and ad inventory to sell.
An ad network connects advertising demand—advertisers looking to buy—with supply from publishers looking to sell. In its simplest form, AdMob is an example of an ad network.
An ad exchange is a technology-driven marketplace where buyers and sellers trade inventory through automated processes instead of negotiating each deal manually. It is part of the infrastructure that allows an opportunity to be bought and sold in the time it takes a screen to load.
A DSP (Demand-Side Platform) helps advertisers decide which opportunities they want to buy and how much they are willing to bid for each one, usually automatically and in real time.
An SSP (Supply-Side Platform) serves the publisher side. It helps inventory owners expose their supply to as much demand as possible and maximize its selling price. If a DSP answers “what should I buy?”, an SSP answers “how can I sell my inventory at the best price?”
A mediation platform connects a publisher’s inventory to several demand sources instead of relying on just one. We will not yet explore how it chooses which source wins each opportunity—that involves waterfalls and bidding, and deserves a dedicated article later in the series.
With that map in place, we can follow what happens from the moment an app asks for an ad until that ad generates revenue.
What happens between requesting an ad and seeing it?
It is 6:30 p.m. A user in Spain opens the home screen of an app with an integrated banner. That simple action sets the entire process in motion.
The app requests an ad
When the screen loads, the app sends an ad request to the ad platform: “I have space available right now. Do you have something to show here?”
This distinction matters: a request is not an impression. It is only the first step in a process that can still stop at several points before the user sees anything.
The opportunity reaches the market
The request is accompanied by signals that help the market value the opportunity: the app it came from, the user’s country, the platform (iOS or Android), device type, requested format, context within the app, and—where applicable—the user’s consent for certain forms of targeting. Privacy and consent deserve their own article, but it is worth knowing that these signals are part of the opportunity from the start.
Demand decides what the opportunity is worth
Potential buyers use that information to decide whether they want the opportunity and, if they do, how much they are willing to pay. That offer is called a bid.
Not every advertiser values the same opportunity equally. An advertiser operating only in Spain might bid strongly for a Spanish impression and not bid at all for one from a country it does not serve. The value of an opportunity depends entirely on who is evaluating it.
An ad is selected
When several buyers want the same opportunity, an auction determines which bid wins the space. For now, the concept is enough. Auction models such as first-price auctions will return when we cover mediation and bidding in detail.
The request may be matched
If the process finds an ad willing to fill the space, the request is matched. The proportion of requests that find an ad is called the fill rate or match rate, depending on the platform. The terminology varies slightly, but the underlying idea is the same.
Not every request is matched. There may be no interested buyer for that format, country, and moment. In that case, the request remains unfilled and the space stays empty or falls back to another mechanism.
The ad is available, but has not been shown yet
Finding an ad does not mean that the user will see it. They might leave the screen before it finishes loading, navigate elsewhere, lose their connection, or encounter a rendering error.
The proportion of matched ads that are actually displayed is called the show rate.
An impression finally occurs
Only when the ad reaches the user’s screen and is actually displayed do we count an impression. This is the first point at which we can say, without qualification, that an ad was shown.
The user may interact
The user can ignore the ad—which is by far the most common outcome—or click it. After that click, they may complete an action the advertiser cares about, such as installing an app, signing up, or making a purchase. That final action is called a conversion.
Here is the complete journey:
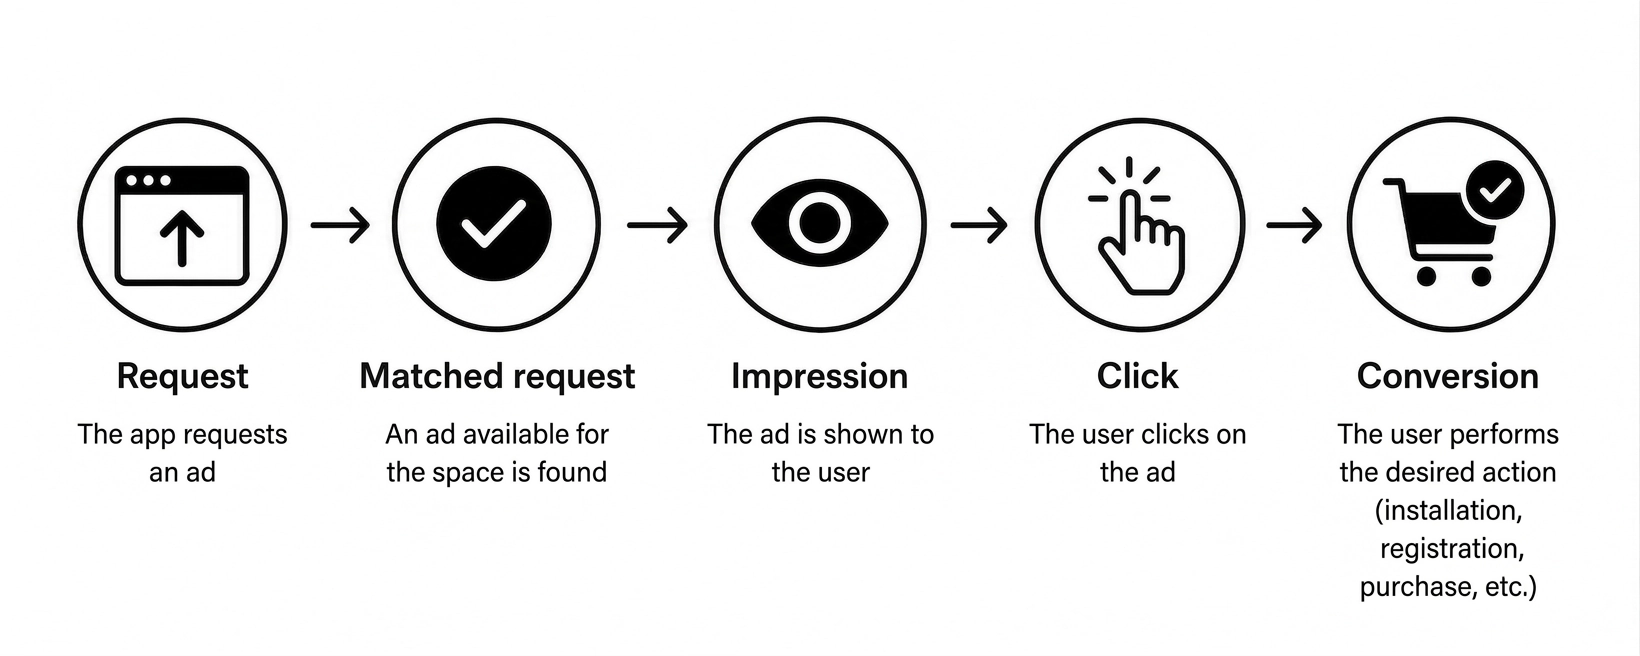
Every arrow is a point where the process can stop. That explains the funnel in the next section.
From 100,000 requests to 67,500 impressions: the ad funnel
Let us put numbers to the journey so it becomes clear why dashboard figures rarely line up at first glance.
Suppose an app generates 100,000 ad requests in one day:
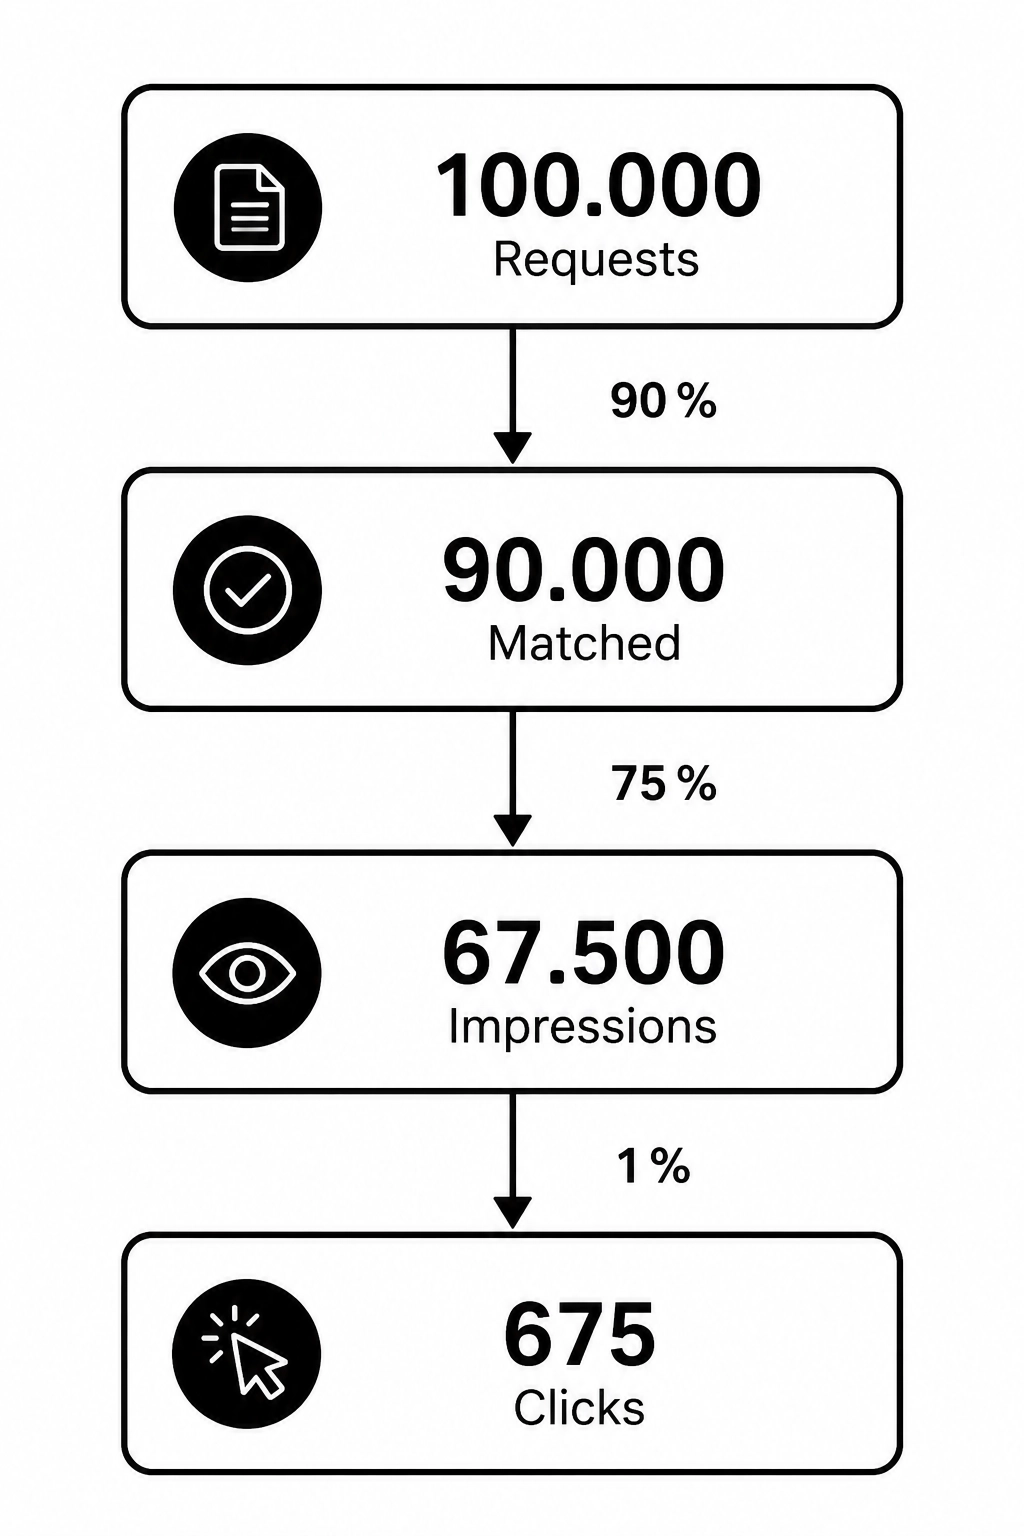
The match rate is 90%: 90,000 of the 100,000 requests find an ad. The show rate is 75%: only 67,500 of those matched requests are ultimately displayed. The CTR, which we will define next, is 1%: 675 of those 67,500 impressions result in a click.
The purpose is not to optimize anything yet. It is to establish a simple but frequently misunderstood point: requests and impressions are not the same thing. If the request count in an ad dashboard is much higher than its impression count, this funnel is why. The system is not broken; it is working as designed.
What do CPM, eCPM, CPC, and CPA actually mean?
This is the most terminology-heavy part of the article, so we will take each metric in turn and focus on what it means in practice.
CPM — Cost Per Mille. The cost per thousand impressions. The “M” comes from the Roman numeral for one thousand, not “million.” Using groups of one thousand avoids dealing with the tiny fractions of a cent associated with a single impression.
eCPM — Effective Cost Per Mille. From a publisher’s perspective, eCPM expresses the average revenue earned per thousand impressions:
eCPM = revenue / impressions × 1,000
If 20,000 impressions generate €30, the eCPM is €1.50. That does not mean every individual group of one thousand ads sold for exactly €1.50. It normalizes the average performance of impressions that may have sold at very different prices. eCPM is an average, not a fixed price.
CPC — Cost Per Click. The cost—or revenue—associated with each click, depending on the billing model and which side of the market you are looking at.
CPI — Cost Per Install. Common in mobile advertising: the advertiser pays for each app install generated by the ad, rather than for every click or impression.
CPA — Cost Per Action / Acquisition. The cost of generating a specific action the advertiser values, such as a registration, subscription, or purchase.
CTR — Click-Through Rate. The percentage of impressions that result in a click:
CTR = clicks / impressions × 100
If 100,000 impressions generate 1,200 clicks, the CTR is 1.2%. One warning we will revisit later: a higher CTR does not automatically mean better app monetization. The complete funnel and the user experience also matter.
The metrics that matter to publishers
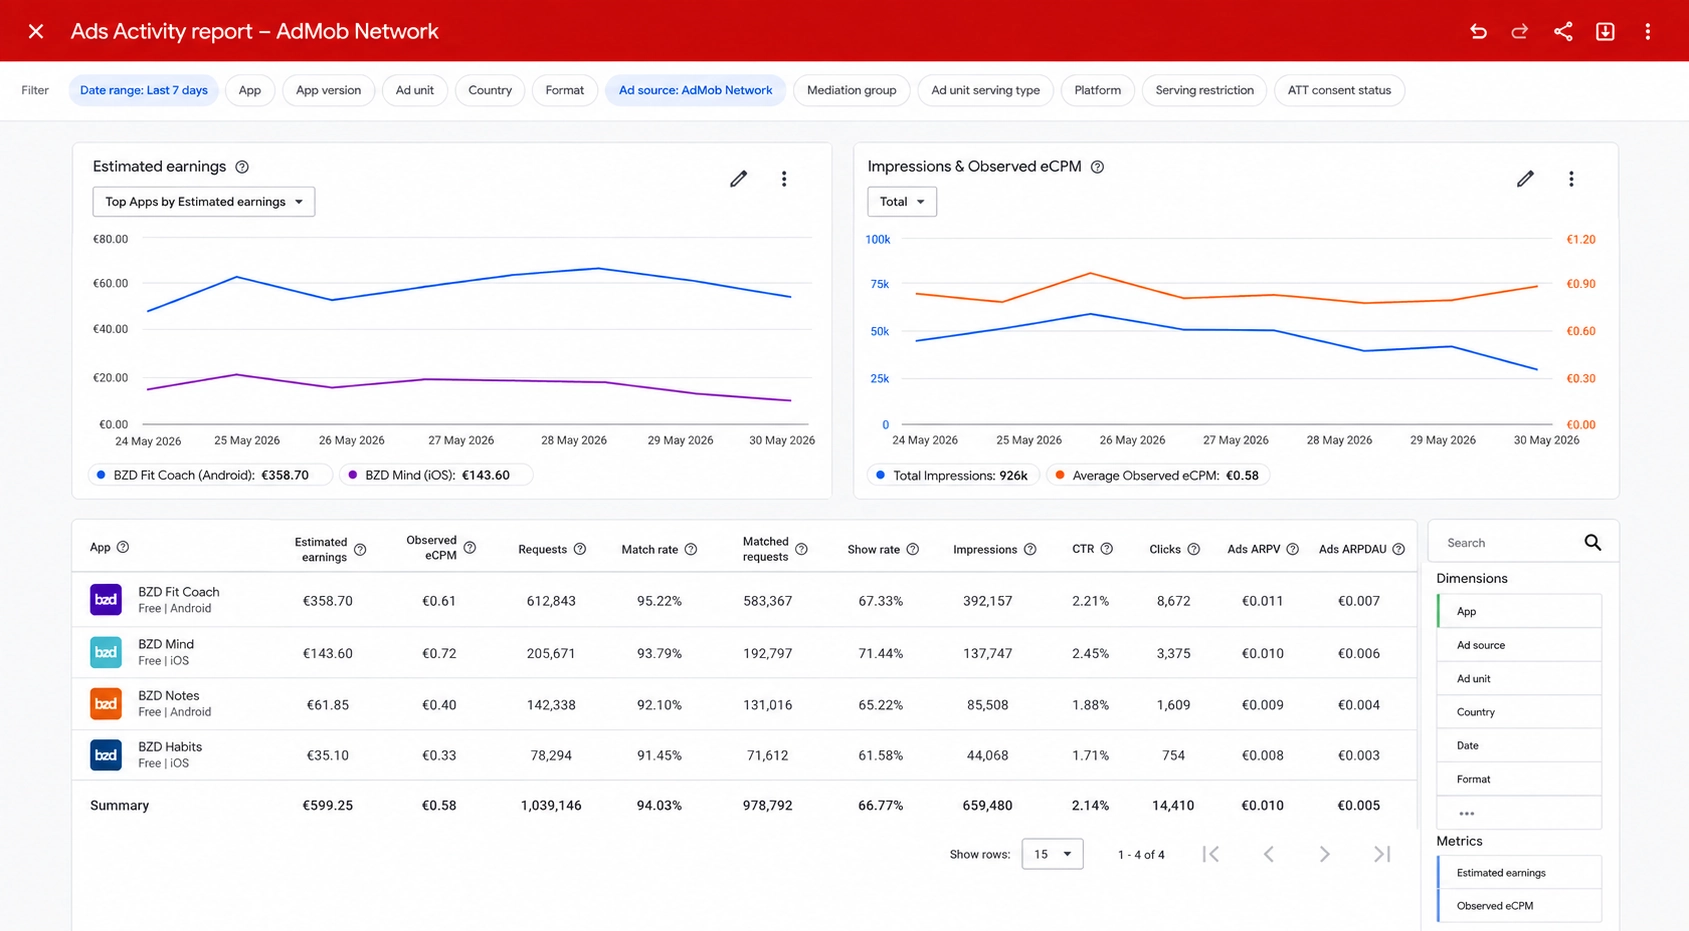
The previous section focused on the price of an ad. This one covers the metrics that, taken together, reveal the overall health of an app’s monetization. Some describe how the funnel operates; others describe the money it produces.
Ad requests. The number of advertising opportunities requested by the app. This is the starting point for everything else.
Matched requests. The number of requests for which an ad was found.
Match rate / fill rate. The percentage of requests that found an ad. Some platforms distinguish slightly between the two terms in particular technical contexts, but they can generally be treated as equivalent in day-to-day reporting.
Impressions. The number of ads that were actually displayed after also passing through the show-rate stage.
Show rate. The proportion of matched ads that were ultimately displayed:
show rate = impressions / matched requests
This easily overlooked metric is highly revealing. A low show rate means ads that have already been found are being lost before users see them, often because of loading issues, network conditions, or navigation behavior.
Estimated revenue. The revenue attributed or reported by the ad platform. Recent figures are usually estimates and may be adjusted later rather than representing settled revenue.
ARPU — Average Revenue Per User. The average revenue generated by each user over a given period:
ARPU = revenue / users
ARPDAU — Average Revenue Per Daily Active User. Alongside eCPM, this is one of the most useful terms to understand because it will recur throughout the series. It represents the average revenue generated by each active user on a given day:
ARPDAU = daily revenue / daily active users (DAU)
If an app has 100,000 DAU and earns €500 per day from ads, its ARPDAU is €500 / 100,000 = €0.005. In more tangible terms, each active user generates an average of half a cent in ad revenue per day.
Ads ARPDAU. Some platforms separate total ARPDAU—which may include in-app purchases or subscriptions—from ARPDAU generated exclusively by advertising. That distinction becomes important in hybrid monetization models.
ARPPU — Average Revenue Per Paying User. Average revenue calculated only across users who pay for something. It is more relevant to purchases and subscriptions than pure advertising, but it appears frequently in monetization discussions.
DAU / MAU. Daily Active Users and Monthly Active Users. These are product metrics rather than strictly advertising metrics, but they underpin most per-user revenue calculations.
Impressions per user. The average number of ads each user sees. This intuitive metric leads directly into frequency: how often a user is exposed to ads, and where additional exposure begins to work against the product rather than for it.
Why can one impression have a €0.20 eCPM and another €10?
The short answer is that an impression’s value never depends on a single factor.
Geography. Advertising markets in the United States, Spain, and emerging economies operate at different price levels. Universal figures quickly become outdated, but the user’s country is usually one of the largest sources of variation.
Platform. iOS and Android can attract different prices for similar inventory, partly because of differences in their users’ average spending behavior.
App category. Audiences are not equally valuable to every advertiser. A personal finance app and a casual game attract very different buyers.
Format. Banners, interstitials, and rewarded ads do not compete for the same budgets. They occupy different spaces and interrupt the experience in different ways, so the market values them differently.
Timing. The hour, day of the week, and quarter of the year all matter. Demand rises around periods such as Christmas and Black Friday and falls at other times. This seasonality makes month-to-month eCPM comparisons misleading without context.
Competition. The more buyers competing for an opportunity, the more upward pressure there is on bids. Heavily contested inventory tends to be worth more.
Available signals. User consent, targeting capabilities, and context help demand assess an opportunity. The more relevant information buyers have, the more precisely they can value it.
Asking “what is a good eCPM?” without specifying country, platform, format, audience, and time of year is therefore not very meaningful. There is no single universal number.
Websites, apps, and games: one market, different products
Requests, matched requests, impressions, and eCPM describe the same underlying market wherever an ad appears. What changes is how each product creates and consumes inventory.
On the web, advertising revolves around pages, content, and navigation. Every page load can create a new opportunity.
In apps, inventory revolves around SDKs, sessions, specific screens, and the app lifecycle—opening, moving into the background, and closing. Placements follow that journey rather than page navigation.
In mobile games, rewarded ads and interstitials play a major role because they fit naturally between matches, after levels, or in exchange for something the player wants.
The economics remain the same. What changes substantially is how inventory is created and how users experience it.
Do more ads mean more money?
Consider an app with 10,000 users that currently shows an average of two impressions per user: 20,000 daily impressions. Raising that frequency to six would produce 60,000 daily impressions—three times as many.
It is tempting to expect three times the revenue. In reality, other variables begin to move as well. eCPM may fall because demand does not grow as quickly as inventory. Show rate may deteriorate if more disruptive formats are forced into the experience. Most importantly, sessions and retention may decline as the product becomes less pleasant to use.
This effect is often called ad fatigue or ad pressure. The more advertising a user receives in a short period, the less tolerance they have for each additional ad—and the more likely they are to leave early or stop using the app altogether.
That brings us to a factor that monetization discussions often overlook: repeat usage.
Why repeat usage matters more than one day’s volume
It is tempting to treat ad monetization as a one-day problem: how many impressions can we generate today, at what eCPM, and for how much revenue? But an app makes money across many days during which the same user continues to return.
A user who opens an app once and never returns can generate only a handful of impressions. Someone who returns daily for months may see fewer ads per session yet generate far more impressions—and revenue—over time.
This is the distinction between ARPDAU and lifetime value (LTV), which we will explore later in the series. ARPDAU measures what a user generates on a particular day; LTV estimates what that user will generate throughout their entire relationship with the app.
Maximizing short-term impressions at the expense of the experience is therefore self-defeating. If ad pressure causes someone to uninstall or stop returning, that user generates no ARPDAU tomorrow, next week, or three months from now. A higher eCPM today rarely compensates for losing a user who would otherwise have kept coming back.
This idea will recur throughout the series:
Maximizing the number of ads shown and maximizing the value an app creates are not the same problem. Long-term value also depends on retention, usage frequency, and an experience worth returning to.
Putting it all together: one day in a fictional app
Suppose an app has 20,000 DAU. Each user generates an average of five ad requests per day:
20,000 DAU × 5 requests per user = 100,000 requests
With a 92% match rate:
100,000 × 0.92 = 92,000 matched requests
With an 80% show rate:
92,000 × 0.80 = 73,600 impressions
At a €2.50 eCPM, daily revenue is:
73,600 / 1,000 × €2.50 = €184
That gives us the Ads ARPDAU:
€184 / 20,000 DAU = €0.0092
If those impressions generated 736 clicks, the CTR is:
736 / 73,600 × 100 = 1%
In plain English: the app had 20,000 active users today. Together they created 100,000 advertising opportunities. We found an ad for 92% of them, but only 80% of those matched ads were actually shown. The resulting 73,600 impressions earned €184, equivalent to a €2.50 eCPM and an Ads ARPDAU of €0.0092.
Each active user therefore generates less than one cent per day in ad revenue. That sounds tiny in isolation, but it is multiplied by 20,000 users today—and generated again tomorrow and the day after, provided those users still have a reason to return.
The point is not to memorize the acronyms
Let us return to the banner from the beginning. At first, the process may have looked as simple as app → ad → money. We now know it looks more like this:
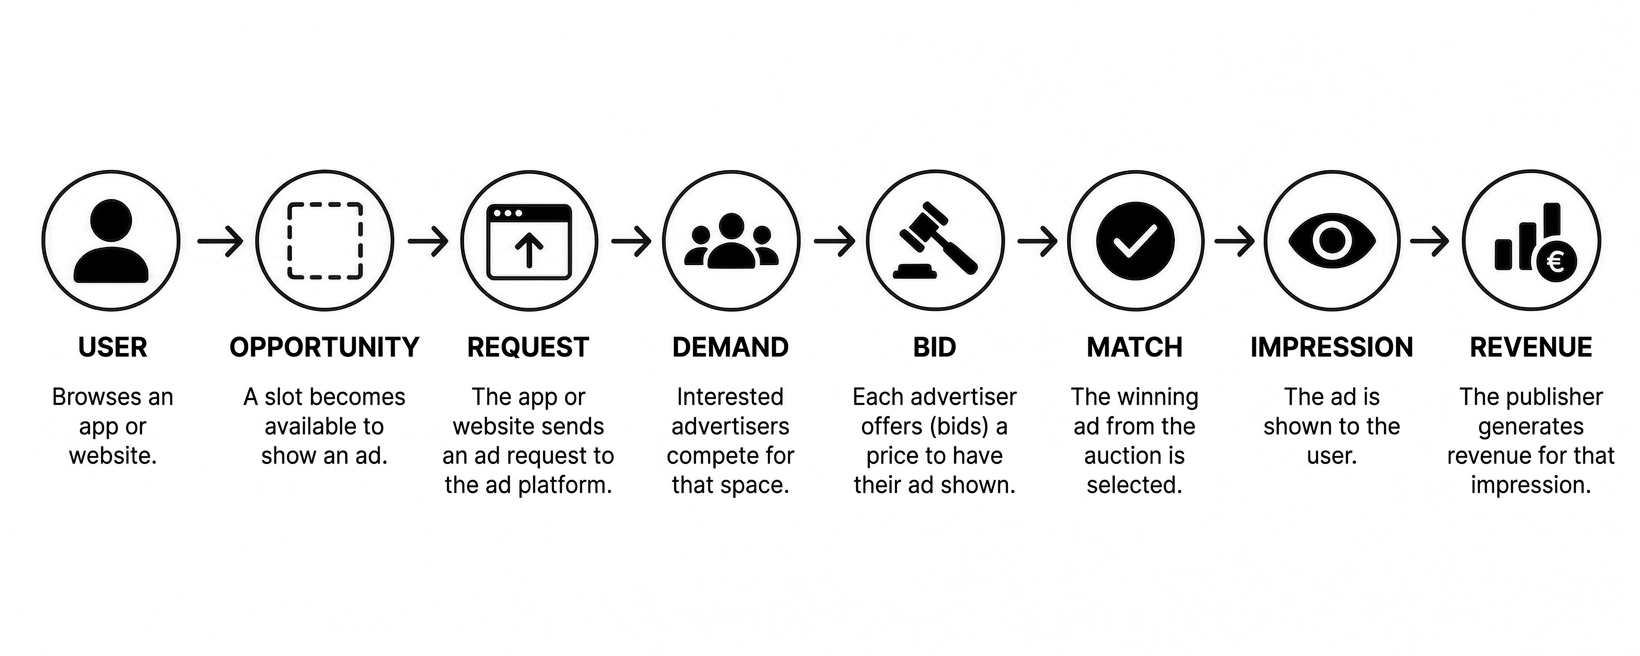
Sustainable revenue depends on a particular combination of factors: users who return regularly, a healthy fill rate and show rate, and an eCPM that makes sense for the market. Without a returning audience, revenue becomes a short-lived spike rather than a durable stream.
Learning what each acronym means is useful. Understanding how the metrics relate to one another matters much more.
Once the market itself makes sense, a more interesting question emerges: should every app be monetized in exactly the same way? That question opens the second article in this series, which will explore which monetization model fits each type of app.
Happy earning!