Throughout the Flutter series we have covered how an application is structured, how to build interfaces with widgets, how to lean on Dart, how to handle asynchronous operations, how to integrate packages, how to bring the UI to life with animations, and how to adapt text content with internationalization. This time we will tackle one of the most common scenarios in any real-world app: communicating with APIs and debugging errors when something breaks along the way.
In Flutter, just “making a request” and hoping everything falls into place is rarely enough. The interface can look perfectly fine, state can update correctly, and the code can compile without a single warning — yet the app still does not work because the issue lives in the conversation between client and server. That is exactly where Flutter DevTools shines: it is not only for layout inspection, performance profiling, or memory analysis — it also lets you inspect network traffic and understand precisely what left the app and what the backend actually returned.
In this article we will look at what an API is, the most common types, how they are consumed from Flutter at a conceptual level, and — most importantly — how to detect and fix a real HTTP communication failure using DevTools.
Flutter rarely lives in isolation
When we first start working with Flutter it is natural to focus on the interface: widget composition, navigation, state management. These are the most visible pieces and they give us the satisfying feeling that the app “already works”. But as soon as we move beyond purely local examples, we discover that Flutter almost never lives in isolation.
Most real applications depend on one or more external or internal services to do their job. A login flow needs to validate credentials on a server. A product catalogue needs to load data that changes over time. An admin dashboard needs fresh metrics. A logistics app needs to update shipment statuses. Even an app that looks simple on the surface can depend on dynamic content, cross-device sync, or remote configuration.
That changes the nature of development entirely. At that point it is no longer enough to build a nice screen or wire up a button to an action. The app becomes dependent on a constant conversation with systems that live outside the device. And when that conversation breaks down, users do not experience it as a “network issue” or a “bad API contract” — they just feel like the app does not work.
What an API is and why it matters
An API (Application Programming Interface) is, at its core, an interface that lets two systems talk to each other. In a Flutter app that typically means sending requests to a server to read, create, or update data.
From Flutter’s perspective, that communication almost always takes the same shape: an HTTP request to an endpoint, a response carrying a status code and a body — usually JSON — and a parsing step that transforms that JSON into Dart models the UI can work with.
When a Flutter app “stops working”, the root cause is often not the widget rendering the data but something further up the chain: the base URL, the specific endpoint, the query parameters, the HTTP headers, the response body, the status code, or even the mapping from JSON keys to Dart fields.
That is why consuming an API matters — but knowing how to debug that communication matters even more.
The most common API types
There are several ways to design an API. We do not need to go deep on all of them, but having a rough picture of the landscape is useful:
| Type | Common format | Strengths | Weaknesses | Typical use case |
|---|---|---|---|---|
| REST | JSON over HTTP | Simple, widely adopted | May return more or less data than needed | General web and mobile apps |
| GraphQL | Queries over HTTP | Client requests exactly what it needs | Higher initial complexity | Apps with complex data requirements |
| SOAP | XML | Highly standardized in enterprise environments | Verbose and heavy | Banking, government, legacy systems |
| RPC / gRPC | Procedures, often with Protobuf | Very fast and efficient | Less friendly to simple manual inspection | Microservices and internal backend |
WebSockets are also worth mentioning for real-time communication, although they are not the focus of this article. For the practical example we will use REST — it is easy to reason about, still very common in mobile apps, and lends itself nicely to visual inspection from DevTools.
A few good practices before diving in
Before jumping into the example it is worth establishing some baseline habits. Never assume the backend responds
exactly as expected. It always pays to inspect the endpoint, the HTTP method, the query parameters, the headers,
the status code, the response body, and the response times. On the Flutter side, keep network logic separate from
the UI, handle loading, error, and success states explicitly, catch network exceptions properly, and avoid
exposing sensitive data during debugging. Above all, resist the urge to scatter print() calls throughout the code
when DevTools can give you a far more precise picture.
Why these errors are so common in Flutter
One of the reasons network debugging matters so much in Flutter is that this category of errors tends to be
deceptive. The app compiles, the interface renders correctly, the TextField captures the right value, the button
responds, and the state appears to update. Everything looks fine from the outside — yet the data never arrives, or
arrives in an unexpected shape, or triggers a silent failure that quietly breaks the user experience.
In many cases the issue is not in the layout or the visual logic but in the HTTP layer. Sometimes it is a wrong path,
sometimes a malformed parameter, a missing header, a 401 or 404 that is not handled properly, or a JSON response
whose contract does not exactly match the model defined in Dart. These are small errors in appearance but with a
large impact, because they cut the entire flow between the app and the actual data source.
This explains why relying only on exception messages or a chain of print() calls is rarely enough. Those tools can
help in the early stages, but they do not always make it clear what left the client, what the server received, or
exactly where the communication broke. Without seeing the real traffic, diagnosing the problem usually turns into a
chain of guesses.
DevTools as an observability tool
This is where Flutter DevTools comes into its own. DevTools is often thought of as a suite of utilities for measuring performance, inspecting memory, or reviewing visual aspects of the UI — and it absolutely is all of those things. But in apps that consume APIs it also plays another equally valuable role: an observability tool.
Being able to inspect a real request completely changes the way you debug. You no longer depend solely on what you
think you sent or how you interpret a generic exception. You can see with precision which URL left the client, which
HTTP method was used, which headers accompanied the request, how long the response took, which status code the
server returned, and what the exact body was that came back to the app. That visibility dramatically narrows the
distance between the symptom and the actual cause.
In other words, DevTools does not just help you confirm that something is broken — it helps you understand why it is broken. And that difference is what turns a slow, intuition-driven debugging session into a much more reliable technical process.
With that context in place, we can now move on to a small but realistic case where an apparently correct Flutter app fails due to an HTTP communication problem, and where Flutter DevTools will let us find the exact cause and fix it.
Practical example: order tracking with a local REST API
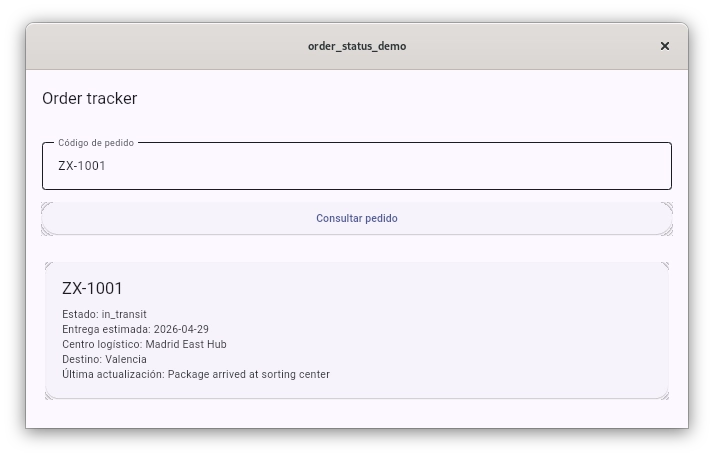
To keep the example self-contained and reproducible, we will build a simple Flutter app that queries the status of an
order against a local REST API. The user enters a code like ZX-1001 and the app displays the order code, its
status, the estimated delivery date, the warehouse, the last update, and the final destination.
For this example we will use a Dockerized Express JS API, a reasonably rich set of dummy data, and a single main endpoint:
GET /api/v1/orders/:orderCode
The expected response looks something like this:
	{
	  "order_code": "ZX-1001",
	  "status": "in_transit",
	  "estimated_delivery": "2026-04-29",
	  "warehouse": "Madrid East Hub",
	  "destination_city": "Valencia",
	  "last_update": "Package arrived at sorting center"
	}
Full project structure
Rather than leaving pieces implicit, here are all the minimal files needed to run the example:
	order-status-demo/
	├── backend/
	│   ├── data/
	│   │   └── orders.json
	│   ├── .dockerignore
	│   ├── Dockerfile
	│   ├── package.json
	│   └── server.js
	├── flutter_app/
	│   ├── lib/
	│   │   ├── models/
	│   │   │   └── order_status.dart
	│   │   ├── services/
	│   │   │   └── order_service.dart
	│   │   └── main.dart
	│   └── pubspec.yaml
	└── docker-compose.yml
Dockerized Express backend
The API does not aim to be sophisticated. What we need is a local server that is stable, readable, and reproducible so we can inspect requests properly from Flutter DevTools.
docker-compose.yml
	services:
	  orders-api:
	    build:
	      context: ./backend
	    container_name: orders-api
	    ports:
	      - "3000:3000"
backend/.dockerignore
	node_modules
	npm-debug.log
backend/package.json
	{
	  "name": "orders-api",
	  "version": "1.0.0",
	  "description": "Dummy Express API for Flutter DevTools debugging article",
	  "main": "server.js",
	  "scripts": {
	    "start": "node server.js"
	  },
	  "dependencies": {
	    "cors": "^2.8.5",
	    "express": "^4.19.2"
	  }
	}
backend/Dockerfile
	FROM node:22-alpine

	WORKDIR /app

	COPY package.json ./
	RUN npm install

	COPY . .

	EXPOSE 3000

	CMD ["npm", "start"]
backend/server.js
	const express = require('express');
	const cors = require('cors');
	const fs = require('fs');
	const path = require('path');

	const app = express();
	const PORT = 3000;

	app.use(cors());
	app.use(express.json());

	function loadOrders() {
	  const ordersPath = path.join(__dirname, 'data', 'orders.json');
	  const raw = fs.readFileSync(ordersPath, 'utf8');
	  return JSON.parse(raw);
	}

	app.get('/health', (_request, response) => {
	  response.json({ status: 'ok' });
	});

	app.get('/api/v1/orders', (_request, response) => {
	  response.json(loadOrders());
	});

	app.get('/api/v1/orders/:orderCode', (request, response) => {
	  const { orderCode } = request.params;
	  const orders = loadOrders();

	  const order = orders.find(
	    (item) => item.order_code.toLowerCase() === orderCode.toLowerCase(),
	  );

	  if (!order) {
	    return response.status(404).json({
	      message: 'Order not found',
	      order_code: orderCode,
	    });
	  }

	  return response.json(order);
	});

	app.listen(PORT, () => {
	  console.log(`Orders API running on http://localhost:${PORT}`);
	});
backend/data/orders.json
To make the example feel closer to a real environment we will work with a dataset like the one below. In production these records would typically come from a database or another service; here we keep things simple with a single JSON file:
	[
	  {
	    "order_code": "ZX-1001",
	    "status": "in_transit",
	    "estimated_delivery": "2026-04-29",
	    "warehouse": "Madrid East Hub",
	    "destination_city": "Valencia",
	    "last_update": "Package arrived at sorting center"
	  },
	  {
	    "order_code": "ZX-1002",
	    "status": "processing",
	    "estimated_delivery": "2026-05-01",
	    "warehouse": "Barcelona Logistics Center",
	    "destination_city": "Bilbao",
	    "last_update": "Order packed and ready for dispatch"
	  },
	  {
	    "order_code": "ZX-1003",
	    "status": "delivered",
	    "estimated_delivery": "2026-04-25",
	    "warehouse": "Seville South Hub",
	    "destination_city": "Seville",
	    "last_update": "Delivered to recipient"
	  },
	  {
	    "order_code": "ZX-1004",
	    "status": "pending_payment",
	    "estimated_delivery": "2026-05-03",
	    "warehouse": "Madrid East Hub",
	    "destination_city": "Zaragoza",
	    "last_update": "Awaiting payment confirmation"
	  },
	  {
	    "order_code": "ZX-1005",
	    "status": "ready_for_dispatch",
	    "estimated_delivery": "2026-04-30",
	    "warehouse": "Porto Cross-Dock",
	    "destination_city": "A Coruna",
	    "last_update": "Shipment label created"
	  },
	  {
	    "order_code": "ZX-1006",
	    "status": "in_transit",
	    "estimated_delivery": "2026-05-02",
	    "warehouse": "Lisbon Atlantic Hub",
	    "destination_city": "Vigo",
	    "last_update": "Left origin facility"
	  },
	  {
	    "order_code": "ZX-1007",
	    "status": "delayed",
	    "estimated_delivery": "2026-05-04",
	    "warehouse": "Barcelona Logistics Center",
	    "destination_city": "Malaga",
	    "last_update": "Delivery delayed due to weather conditions"
	  },
	  {
	    "order_code": "ZX-1008",
	    "status": "processing",
	    "estimated_delivery": "2026-05-05",
	    "warehouse": "Madrid East Hub",
	    "destination_city": "Granada",
	    "last_update": "Items being consolidated"
	  },
	  {
	    "order_code": "ZX-1009",
	    "status": "out_for_delivery",
	    "estimated_delivery": "2026-04-27",
	    "warehouse": "Murcia Local Depot",
	    "destination_city": "Murcia",
	    "last_update": "Courier assigned to final route"
	  },
	  {
	    "order_code": "ZX-1010",
	    "status": "returned",
	    "estimated_delivery": "2026-05-06",
	    "warehouse": "Valencia Returns Center",
	    "destination_city": "Alicante",
	    "last_update": "Recipient unavailable, package returning to sender"
	  },
	  {
	    "order_code": "ZX-1011",
	    "status": "customs_review",
	    "estimated_delivery": "2026-05-07",
	    "warehouse": "Madrid Airport Cargo",
	    "destination_city": "Pamplona",
	    "last_update": "Shipment under customs inspection"
	  },
	  {
	    "order_code": "ZX-1012",
	    "status": "in_transit",
	    "estimated_delivery": "2026-05-01",
	    "warehouse": "Bilbao North Hub",
	    "destination_city": "Santander",
	    "last_update": "Transferred to regional carrier"
	  }
	]
With this we have a local REST API that is reproducible and rich enough to test successful lookups, 404 errors,
different order statuses, and more realistic response payloads.
Flutter: a minimal but complete client app
The Flutter side is intentionally small. All we need is a TextField for entering the order code, a button to
trigger the query, a loading indicator, a result card, and an error message when the call fails.
flutter_app/pubspec.yaml
	name: order_status_demo
	description: Demo app for debugging HTTP requests with Flutter DevTools
	publish_to: "none"
	version: 1.0.0+1

	environment:
	  sdk: ^3.8.0

	dependencies:
	  flutter:
	    sdk: flutter
	  http: ^1.2.1

	dev_dependencies:
	  flutter_test:
	    sdk: flutter
	  flutter_lints: ^5.0.0

	flutter:
	  uses-material-design: true
flutter_app/lib/models/order_status.dart
	class OrderStatus {
	  final String orderCode;
	  final String status;
	  final String estimatedDelivery;
	  final String warehouse;
	  final String destinationCity;
	  final String lastUpdate;

	  const OrderStatus({
	    required this.orderCode,
	    required this.status,
	    required this.estimatedDelivery,
	    required this.warehouse,
	    required this.destinationCity,
	    required this.lastUpdate,
	  });

	  factory OrderStatus.fromJson(Map<String, dynamic> json) {
	    return OrderStatus(
	      orderCode: json['order_code'] as String,
	      status: json['status'] as String,
	      estimatedDelivery: json['estimated_delivery'] as String,
	      warehouse: json['warehouse'] as String,
	      destinationCity: json['destination_city'] as String,
	      lastUpdate: json['last_update'] as String,
	    );
	  }
	}
This mapping is important because it makes explicit that the backend returns snake_case keys while Dart conventionally
uses camelCase properties.
flutter_app/lib/services/order_service.dart
This is where we introduce the intentional bug for the article. The app will call an incorrect path:
	import 'dart:convert';

	import 'package:http/http.dart' as http;

	import '../models/order_status.dart';

	class OrderService {
	  final String baseUrl;

	  const OrderService(this.baseUrl);

	  Future<OrderStatus> fetchOrder(String orderCode) async {
	    final uri = Uri.parse('$baseUrl/api/v1/order/$orderCode');
	    final response = await http.get(uri);

	    if (response.statusCode == 200) {
	      final data = jsonDecode(response.body) as Map<String, dynamic>;
	      return OrderStatus.fromJson(data);
	    }

	    if (response.statusCode == 404) {
	      throw Exception('Order not found');
	    }

	    throw Exception('Unexpected error: ${response.statusCode}');
	  }
	}
The detail is small but decisive: the app uses /api/v1/order/ in the singular, while the backend exposes
/api/v1/orders/ in the plural. This kind of mistake is extremely common in real projects, which is exactly what
makes it such a useful debugging exercise.
flutter_app/lib/main.dart
	import 'package:flutter/material.dart';

	import 'models/order_status.dart';
	import 'services/order_service.dart';

	void main() {
	  runApp(const OrderStatusApp());
	}

	class OrderStatusApp extends StatelessWidget {
	  const OrderStatusApp({super.key});

	  @override
	  Widget build(BuildContext context) {
	    return MaterialApp(
	      title: 'Order tracker',
	      debugShowCheckedModeBanner: false,
	      theme: ThemeData(
	        colorScheme: ColorScheme.fromSeed(seedColor: Colors.indigo),
	        useMaterial3: true,
	      ),
	      home: const OrderLookupPage(),
	    );
	  }
	}

	class OrderLookupPage extends StatefulWidget {
	  const OrderLookupPage({super.key});

	  @override
	  State<OrderLookupPage> createState() => _OrderLookupPageState();
	}

	class _OrderLookupPageState extends State<OrderLookupPage> {
	  final controller = TextEditingController(text: 'ZX-1001');
	  final service = const OrderService('http://localhost:3000');

	  bool loading = false;
	  String? errorMessage;
	  OrderStatus? order;

	  Future<void> searchOrder() async {
	    setState(() {
	      loading = true;
	      errorMessage = null;
	      order = null;
	    });

	    try {
	      final result = await service.fetchOrder(controller.text.trim());
	      setState(() {
	        order = result;
	      });
	    } catch (error) {
	      setState(() {
	        errorMessage = error.toString();
	      });
	    } finally {
	      setState(() {
	        loading = false;
	      });
	    }
	  }

	  @override
	  void dispose() {
	    controller.dispose();
	    super.dispose();
	  }

	  @override
	  Widget build(BuildContext context) {
	    return Scaffold(
	      appBar: AppBar(title: const Text('Order tracker')),
	      body: Padding(
	        padding: const EdgeInsets.all(16),
	        child: Column(
	          crossAxisAlignment: CrossAxisAlignment.stretch,
	          children: [
	            TextField(
	              controller: controller,
	              decoration: const InputDecoration(
	                border: OutlineInputBorder(),
	                labelText: 'Order code',
	                hintText: 'ZX-1001',
	              ),
	            ),
	            const SizedBox(height: 12),
	            ElevatedButton(
	              onPressed: loading ? null : searchOrder,
	              child: const Text('Look up order'),
	            ),
	            const SizedBox(height: 24),
	            if (loading) const Center(child: CircularProgressIndicator()),
	            if (errorMessage != null)
	              Text(
	                errorMessage!,
	                style: TextStyle(
	                  color: Theme.of(context).colorScheme.error,
	                  fontWeight: FontWeight.w600,
	                ),
	              ),
	            if (order != null)
	              Card(
	                child: Padding(
	                  padding: const EdgeInsets.all(16),
	                  child: Column(
	                    crossAxisAlignment: CrossAxisAlignment.start,
	                    children: [
	                      Text(
	                        order!.orderCode,
	                        style: Theme.of(context).textTheme.titleLarge,
	                      ),
	                      const SizedBox(height: 8),
	                      Text('Status: ${order!.status}'),
	                      Text('Estimated delivery: ${order!.estimatedDelivery}'),
	                      Text('Warehouse: ${order!.warehouse}'),
	                      Text('Destination: ${order!.destinationCity}'),
	                      Text('Last update: ${order!.lastUpdate}'),
	                    ],
	                  ),
	                ),
	              ),
	          ],
	        ),
	      ),
	    );
	  }
	}
The app is deliberately simple because the focus of the article is not the architecture but the HTTP traffic inspection and error location.
How to run the example
First, start the API:
docker compose up --build
Then, from flutter_app/, install the dependencies:
flutter pub get
Summary by environment
Since this example is assembled by hand from an editor, on desktop it is not enough to just have lib/ and
pubspec.yaml — Flutter also needs to generate the native runner for each platform using flutter create . or
flutter create --platforms=... ..
| Environment | Setup required | Run command | Recommended base URL |
|---|---|---|---|
| Linux Desktop | flutter config --enable-linux-desktop and flutter create --platforms=linux . |
flutter run -d linux |
http://localhost:3000 |
| macOS Desktop | flutter config --enable-macos-desktop and flutter create --platforms=macos . |
flutter run -d macos |
http://localhost:3000 |
| Windows Desktop | flutter config --enable-windows-desktop and flutter create --platforms=windows . |
flutter run -d windows |
http://localhost:3000 |
| Android Emulator | None if the project already exists | flutter run |
http://10.0.2.2:3000 |
| iOS Simulator | None if the project already exists | flutter run |
http://localhost:3000 |
To check which devices Flutter recognizes on your machine, run:
flutter devices
How to open Flutter DevTools in the browser
Once the app is running in debug mode with flutter run, the terminal usually shows both the Dart VM Service URL
and the Flutter DevTools URL ready to open in the browser:
	A Dart VM Service on Linux is available at: http://127.0.0.1:39829/9tOEZegyRMs=/
	The Flutter DevTools debugger and profiler on Linux is available at:
	http://127.0.0.1:9100?uri=http://127.0.0.1:39829/9tOEZegyRMs=/
| Item | Purpose | What to do |
|---|---|---|
Dart VM Service URL |
Internal debugging endpoint for the app | Only needed if you connect DevTools manually |
Flutter DevTools URL |
Opens DevTools already linked to the running app | This is the URL to paste into your browser |
If your terminal does not show the link, or you prefer to launch DevTools separately, you can start it explicitly in another terminal window:
dart devtools
That command starts a local DevTools instance and gives you a URL to open in the browser. Once open, paste the
Dart VM Service URL shown by flutter run to connect DevTools to the app you are debugging.
The bug: the app compiles, but the request fails
Picture the typical flow: the user enters ZX-1001, taps the button, and the app comes back with an error. At first
glance we might guess the backend is down, the order does not exist, the JSON parsing is failing, or even that the
widget is not rebuilding properly. But none of those hypotheses give us certainty. We need to observe the actual
request, and that is where DevTools comes in.
Debugging with Flutter DevTools
This is the most important part of the article. With the app running in development mode and DevTools open in the browser, navigate to the network panel to inspect the HTTP requests emitted by the application. The things worth checking there are the HTTP method, the final URL, the status code, the headers, the response time, and the body returned by the server.
Diagnostic flow
The recommended process looks like this:
- Enter
ZX-1001in the app. - The request fails.
- Open DevTools in the browser and go to the network panel.
- Find the HTTP request that was just sent.
- Review the exact URL and the
status code.
At that point we will see something like this:
	GET http://localhost:3000/api/v1/order/ZX-1001
	Status: 404 Not Found
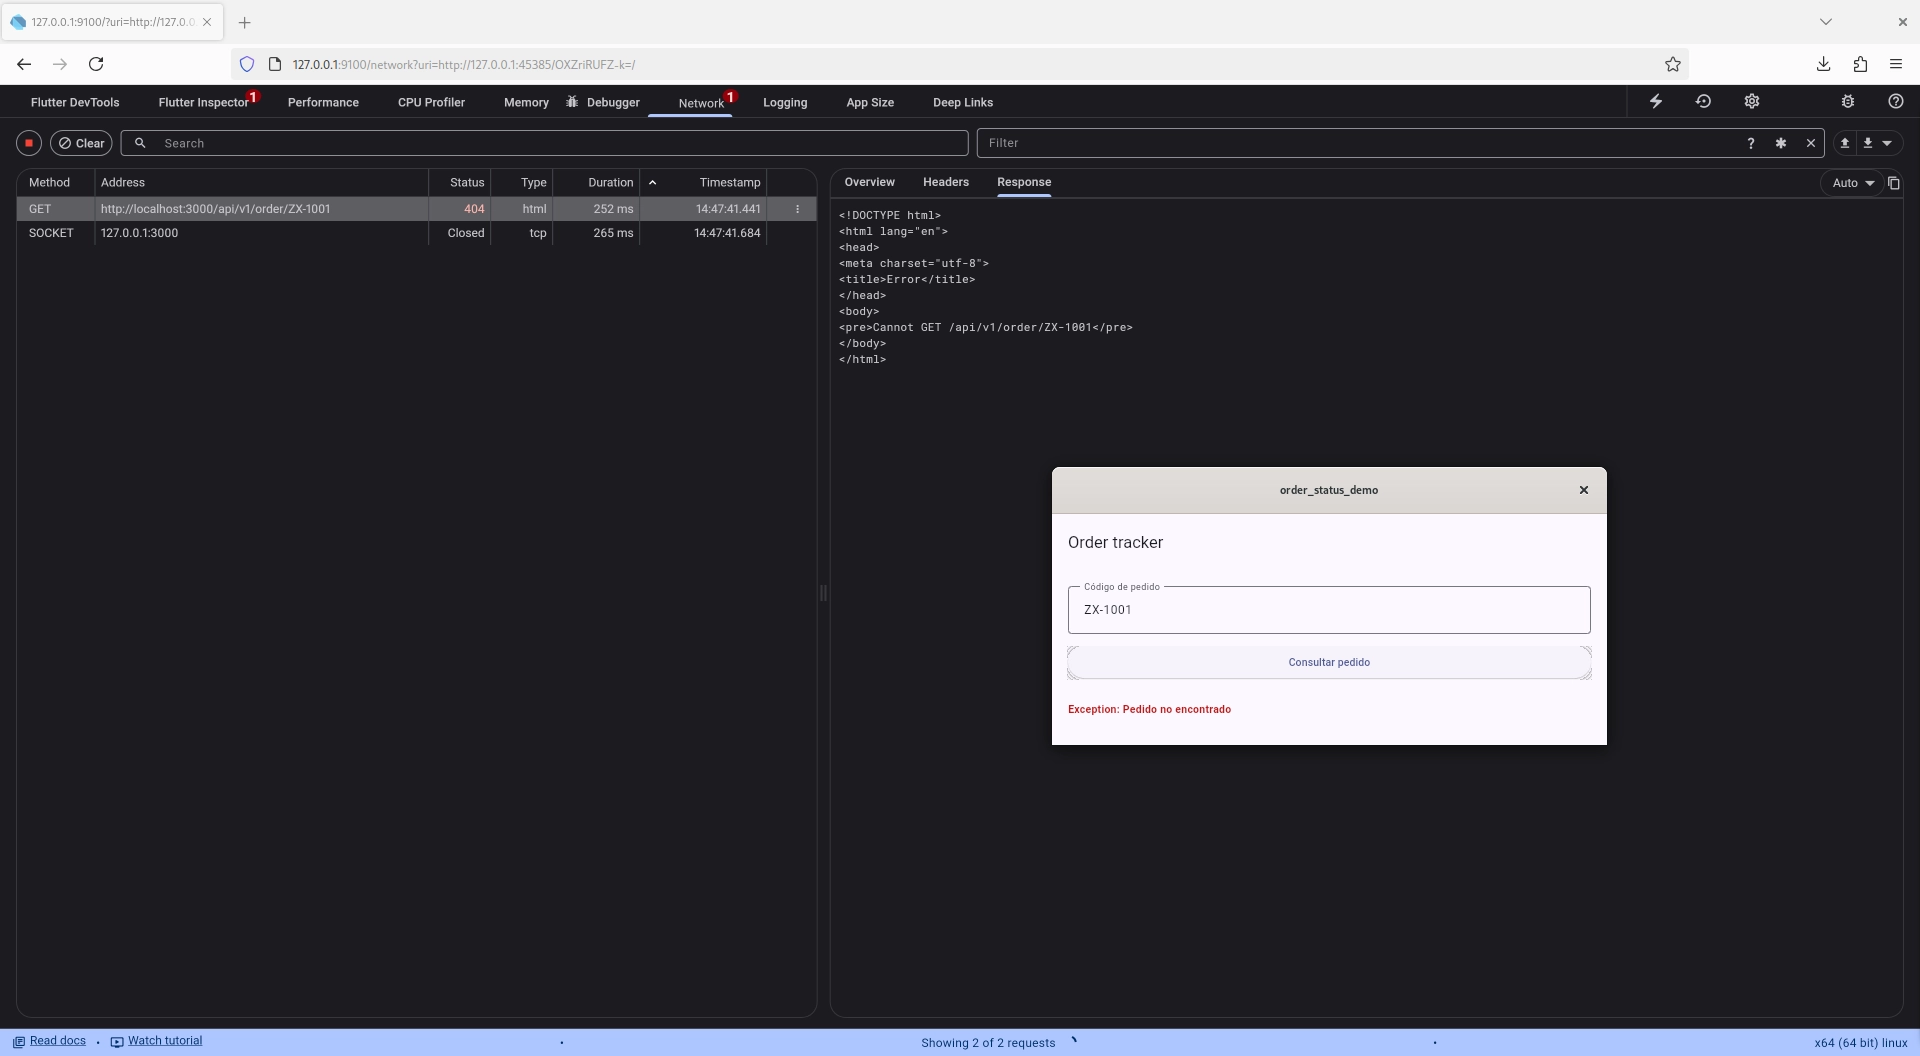
That single piece of information completely changes the diagnosis. The problem is not in the TextField, not in
setState, not in the Dart model. The problem is that the path sent by the client does not match the one published
by the server.
This is exactly what makes DevTools so useful: it removes guesswork. We can see precisely what left the client and what the backend replied.
Fixing the error
The fix is a single line change:
final uri = Uri.parse('$baseUrl/api/v1/orders/$orderCode');
The full corrected service looks like this:
	Future<OrderStatus> fetchOrder(String orderCode) async {
	  final uri = Uri.parse('$baseUrl/api/v1/orders/$orderCode');
	  final response = await http.get(uri);

	  if (response.statusCode == 200) {
	    final data = jsonDecode(response.body) as Map<String, dynamic>;
	    return OrderStatus.fromJson(data);
	  }

	  if (response.statusCode == 404) {
	    throw Exception('Order not found');
	  }

	  throw Exception('Unexpected error: ${response.statusCode}');
	}
Now we run the same query again. Enter ZX-1001, inspect the request in DevTools, confirm the URL is correct, verify
the server returns 200 OK, and check that the UI now displays the data. What we will see this time is:
	GET http://localhost:3000/api/v1/orders/ZX-1001
	Status: 200 OK
If we also inspect the JSON body from DevTools we can validate that the backend keys match the mapping used in
OrderStatus.fromJson.
A second possible error: JSON mapping
If you want to extend the example, you could introduce a second small bug in the client model — for instance,
expecting estimatedDelivery and lastUpdate directly from the JSON:
	estimatedDelivery: json['estimatedDelivery'] as String,
	lastUpdate: json['lastUpdate'] as String,
That would not work because the API returns:
	{
	  "estimated_delivery": "2026-04-29",
	  "last_update": "Package arrived at sorting center"
	}
This type of error is also easy to spot once you inspect the actual response and compare it against the Dart model. It is a good demonstration that not all network failures are “connection problems” — many of them are contract mismatches between client and server.
What to take away from this example
This exercise, though small, captures a workflow that comes up regularly in real projects. Flutter apps consume APIs
constantly in production, and most of those operations are asynchronous because they depend on I/O and network. The
example also makes it clear that a visual error in the app does not always originate in the UI, and that DevTools lets
you quickly confirm whether the problem is on the screen or in the HTTP layer. Seeing the final URL, the status code,
and the response body dramatically speeds up the diagnosis.
Conclusion
In Flutter, knowing how to build good-looking interfaces or structure widgets well is not enough on its own. Sooner or later every real application needs to talk to remote services, and that makes debugging HTTP traffic an essential skill.
Flutter DevTools is not only for performance, rendering, or memory analysis. It is also a highly effective tool for understanding how your app is communicating with an API and for pinpointing the actual cause of a failure much faster.
As a next step, you could extend this example by adding more orders, forcing other types of errors, introducing token-based
authentication, testing timeouts, implementing retry logic, or even building a query history. All of that will bring
you closer to the kinds of problems that surface in real Flutter applications.
Happy Building!!