Flutter introduction
Flutter is a mobile app development framework created by Google. It utilizes the Skia rendering …
read moreThe term debugging, so familiar in the world of software development, has a rather interesting history that dates back to the early days of computing. Debugging refers to the process of identifying and correcting errors or “bugs” in a program, and its origin is wrapped in an anecdote that has become part of the folklore of computing.
The most well-known story about the origin of the term debugging dates back to 1947, in the laboratories of Harvard University. Grace Hopper, one of the pioneers of computing, and her team were working on the Harvard Mark II computer. One day, the machine started to malfunction. Upon inspecting the hardware, they found a moth trapped between the computer’s relays, causing the failures. After removing the insect, they documented the incident in the computer’s logbook as the “first actual case of bug being removed” (literally, debugging).
Although the term bug was already used in engineering to refer to defects or technical problems, this incident with the Harvard Mark II popularized the term “debug” in the context of computing. Since then, debugging has become an essential part of software development, symbolizing both the resolution of technical problems and the pursuit of perfection in computational systems.
With the advancement of technology, debugging techniques and tools have evolved significantly. In the early days of programming, developers had to manually review the code and use rudimentary testing devices. With the advent of high-level programming languages and integrated development environments (IDEs), sophisticated tools have been developed that allow programmers to identify and fix errors more efficiently.
Code debugging is an essential skill for software developers, as it enables them to efficiently identify and correct errors, improve code quality, and ensure the proper functioning of applications. Although debugging a program can be a challenging and often frustrating process, mastering debugging techniques and tools is fundamental to becoming a competent and effective programmer.
In this article, we will use a simple example code in C that we will debug to identify and correct errors. The example code simulates basic accounting operations, such as adding and subtracting transactions, and contains an intentional error that we will fix using compilation and debugging tools like gcc and gdb.
During the software development process, there are typically different phases that do not have to be linear; they can overlap or be repeated and do not always have to be carried out in every case.
The debugging process usually coincides with the implementation and testing phases, as this is when errors in the code are identified and corrected. Debugging is a critical process in software development, as errors can have serious consequences on the functionality of applications and the security of systems.
We will start with a small program in C that has some basic accounting functions. Our goal will be to identify and correct one of the errors in the source code. This program performs addition and subtraction operations to keep a record of transactions:
    #include <stdio.h>

    void addTransaction(float *balance, float amount) {
        *balance += amount;
    }

    // Error introduced: Using '+' instead of '-'
    void subtractTransaction(float *balance, float amount) {
        *balance += amount;
    }

    int main() {
        float balance = 0.0;
        char operation;
        float amount;

        printf("Welcome to the Accounting Program\n");
        printf("Enter transaction (format: + 100 or - 50):\n");

        while (1) {
            scanf(" %c %f", &operation, &amount);

            if (operation == '+') {
                addTransaction(&balance, amount);
            } else if (operation == '-') {
                subtractTransaction(&balance, amount);
            } else {
                printf("Invalid operation. Use + or -\n");
            }

            printf("Current balance: %.2f\n", balance);
        }

        return 0;
    }
First, we will compile the program with gcc using the -g option to include debugging information:
gcc -g accounting.c -o accounting
Once compiled, you can run the program with the following command in the terminal:
./accounting
When you run the program, you will see an output similar to the following:
  Welcome to the Accounting Program
  Enter transaction (format: + 100 or - 50):
Let’s see an example of running the program:
    Welcome to the Accounting Program
    Enter transaction (format: + 100 or - 50):
    + 100
    Current balance: 100.00
    - 50
    Current balance: 150.00
    * 25
    Invalid operation. Use + or -
    Current balance: 150.00
Now we will use the gdb debugger to identify and correct errors in the program. To start gdb, simply run the following command in the terminal:
gdb ./accounting
Once gdb is running, the (gdb) prompt will appear at the beginning of the line in our terminal. You can use the following commands to debug the program:
run: Starts the execution of the program.break <line_number>: Sets a breakpoint at the specified line.next: Executes the next line of code.print <variable>: Prints the value of the specified variable.step: Executes the next line of code, stepping into functions if necessary.quit: Exits gdb.help: Displays the list of available commands.Let’s debug the program to identify and correct the error that occurs in the subtractTransaction function. First, we will set a breakpoint at the line where this function is called.
(gdb) break subtractTransaction
It will indicate that a breakpoint has been set at the subtractTransaction function. A breakpoint is a place in the code where the program will stop so we can inspect its state. It will also show the memory address of the subtractTransaction function along with additional information:
Breakpoint 1 at 0x11c3: file accounting.c, line 8.
Next, we will run the program with the run command:
(gdb) run
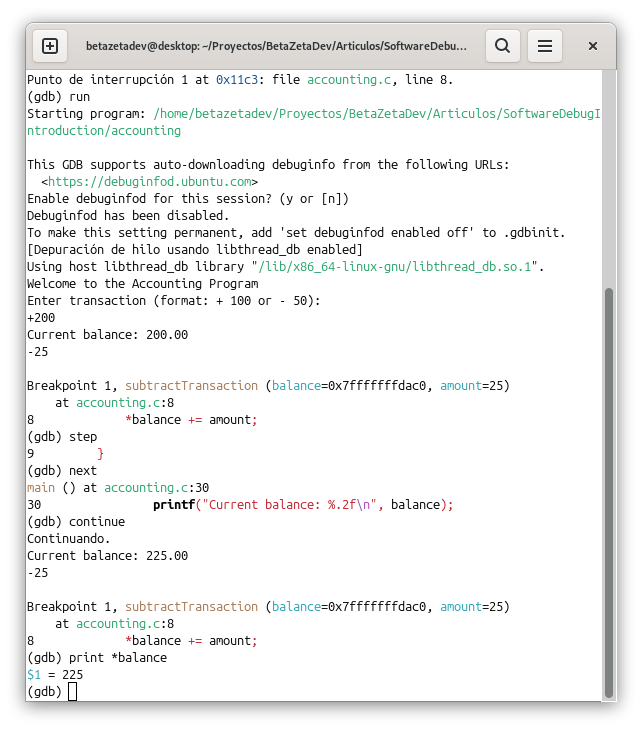
In the program input, type - 50 after adding a positive sum to trigger the breakpoint in subtractTransaction. Use the next command to step through the code inside the function:
(gdb) next
You will observe in the code that it actually has an error since it uses the addition symbol instead of the subtraction symbol. To fix it, simply change the operator from += to -= on line 8 of the code. If you print the value of *balance and amount after entering the values in the terminal, you will see that the balance increases instead of decreasing.
  (gdb) print *balance
  (gdb) print amount
Now that we have located the error, all that remains is to correct it and recompile the program to ensure it works correctly. Once done, the program should function properly, allowing you to perform addition and subtraction operations correctly.
This is an easy-to-see example, even without debugging tools, but it has served to illustrate the debugging process from its basics and how these tools can be used to identify and correct errors in the code. In the next article, we will see how to debug using the tools of a modern IDE, which greatly facilitates the code debugging process for a truly Happy Coding!
That may interest you
Flutter is a mobile app development framework created by Google. It utilizes the Skia rendering …
read moreIn the vast universe of programming, there are principles that, although not commandments, provide …
read moreIntroduction In the previous chapters of our series on Flutter, we’ve laid down a solid …
read more