Essential Flutter Widgets for Your Apps
Flutter is a mobile app development framework created by Google that has gained popularity for its …
read moreMonitoring is one of the fundamental pieces in software development; it helps us ensure the stability and performance of systems. The ability to detect issues before they affect end users, analyze behavior, and optimize performance is vital for any organization that wants to understand the state of its business.
With the vast amount of metrics and logs generated or that can be generated in modern applications, we can obtain a detailed view of the internal workings of both applications and infrastructure. These not only contain information about errors and failures but also provide valuable data on resource usage, user activity, database query performance, and response times, among other critical aspects.
The ability to collect, centralize, and analyze this data in real-time allows organizations not only to react quickly to emerging issues but also to predict trends, identify bottlenecks, and continuously optimize the performance of their applications. This advanced analytics transforms logs from mere historical records into a proactive tool for management and continuous improvement.
Additionally, in an environment where infrastructure is distributed across multiple contexts (public clouds, private clouds, hybrid, or even on-premise), it is essential to have a monitoring solution that can unify and correlate data from various sources. This way, a holistic view of the system’s state is obtained, which is crucial for maintaining high levels of availability and performance.
The ELK stack is a set of open-source tools that has become a reliable alternative for managing, analyzing, and visualizing logs and metrics in real-time. It is an acronym that groups three fundamental components: Elasticsearch, Logstash, and Kibana, each playing a crucial role in the process of monitoring and analyzing data.
Elasticsearch: It is the core of the ELK stack. It is a search and analytics engine based on Lucene, allowing you to store, search, and analyze large volumes of data quickly and efficiently. It can index structured and unstructured data, making it a highly versatile tool for various applications, from text search to logs analysis. Thanks to its distributed architecture, Elasticsearch can scale horizontally, enabling organizations to manage vast amounts of data without sacrificing performance.
Logstash: It is the data processing and collection tool within the ELK stack. It can ingest data from multiple sources, transform it, and send it to destinations like Elasticsearch. Its flexibility in data processing makes it ideal for cleaning, filtering, and enriching logs before storage. Logstash supports a wide range of inputs, outputs, and filters, allowing users to adapt their data flow to their specific needs.
Kibana: It is the user interface of the ELK stack, providing visualization and exploration capabilities for the data stored in Elasticsearch. With Kibana, users can create interactive dashboards, perform advanced searches, and explore data in real-time. This facilitates the identification of patterns, trends, and anomalies in logs, as well as their metrics, enabling operations and development teams to make informed decisions quickly and reliably.
Together, ELK offers a robust solution for system monitoring, allowing organizations not only to store and search large volumes of data but also to analyze and visualize it effectively. This comprehensive capability is what has led ELK to become a preferred choice for application monitoring and logs management in enterprise environments worldwide.
It is important to note that although ELK is a powerful and versatile solution, its high resource consumption necessitates careful deployment and proper configuration to ensure optimal server performance without affecting other services if they are shared.
It all starts with Logstash, responsible for receiving data from multiple sources, such as application logs, system metrics, network data, and more. Logstash acts as a bridge between the data source and its final destination, capturing all relevant information and ensuring that nothing gets lost along the way. But it’s not just about capturing data; Logstash also processes it, applying a series of filters and transformations to clean, normalize, and enrich the data. This makes the data more consistent and useful for subsequent analysis.
Once the data has been collected and processed, it is sent to Elasticsearch. This is where storage and indexing occur. Elasticsearch takes this data, organizes it, and indexes it so that it can be searched and analyzed quickly and efficiently. This structured storage is essential to make the vast amount of information handled by a modern system accessible and useful, allowing complex searches to be performed and real-time results to be obtained.
The next step in the ELK workflow is data visualization, which is carried out through Kibana. Kibana connects to Elasticsearch and allows the user to explore the stored data through an intuitive graphical interface. With Kibana, it’s possible to create interactive dashboards, maps, perform advanced searches, and visualize trends and patterns in a clear and understandable way. This interpretive capability is key to transforming data into useful information that facilitates decision-making.
In addition to these basic functionalities, the ELK stack offers advanced features such as configuring real-time alerts and notifications. Elasticsearch and Kibana can be configured to continuously monitor data and send alerts when anomalous conditions or critical thresholds are detected. This allows operations and development teams to proactively react to emerging issues, minimizing the impact on end users.
Finally, thanks to Elasticsearch’s ability to handle large volumes of data, it is possible to use machine learning tools and other advanced techniques to identify trends, patterns, and anomalies that may not be immediately obvious. This level of analysis enables organizations not only to solve current problems but also to anticipate future changes and, most importantly, to have a deep understanding of their infrastructure’s status.
Installing and configuring the ELK stack can be a complex task, as each of its components requires detailed and precise configurations to work correctly together. However, thanks to the use of Docker containers, we can simplify both the installation and deployment process. For those who want to avoid the complexity of manually configuring each component, there is a repository on GitHub that greatly facilitates this process, and it will be the one we use.
The docker-elk repository, created by deviantony, provides a predefined and optimized configuration to set up a complete ELK environment using Docker Compose. This repository includes all the necessary files to configure and run the Docker containers for Elasticsearch, Logstash, and Kibana, as well as providing additional configurations to add data persistence, security, and other important settings.
The first step is to clone the repository to our local machine and navigate to the docker-elk directory:
  git clone https://github.com/deviantony/docker-elk.git
  cd docker-elk
Once inside the new docker-elk directory, we can run the docker-compose up setup command to initialize and configure the containers. Once it is finished, we will need to bring them up again with an up -d:
  docker-compose up setup
  docker-compose up -d
After waiting a few seconds for the entire environment to start up correctly, we can access Kibana in our web browser via http://localhost:5601. When entering for the first time, Kibana will ask for a username and password, which, although not suitable for production, are sufficient for testing purposes. These are elastic and changeme, respectively.
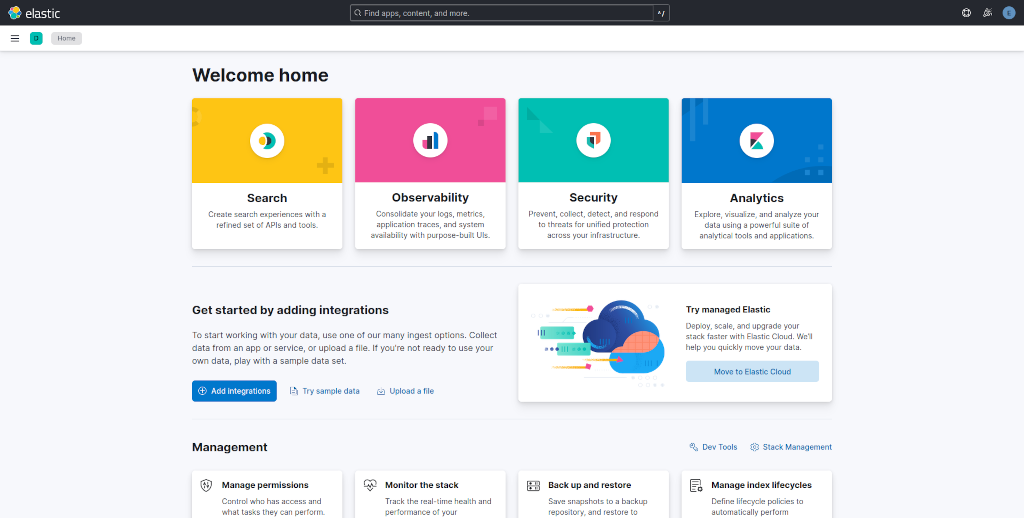
Once inside Kibana, we can start exploring the data and creating custom visualizations. A full explanation of its usage and all its features is beyond the scope of this article, but you can find everything you need in its official documentation. Now, let’s look at a basic use of the ELK stack to monitor logs using a sample script.
To send logs to our ELK environment, we will use a Python script that generates logs randomly and sends them to Logstash via the TCP protocol. This would simulate the sending of records from a real application or device to our monitoring system. The script we will use to log random logs is as follows:
    import time
    import random
    import json
    from datetime import datetime
    from socket import socket, AF_INET, SOCK_STREAM

    # Configuración del cliente para enviar logs a Logstash a través de Beats
    logstash_host = 'localhost'
    logstash_port = 5044

    # Función para enviar logs a Logstash
    def send_log(log_data):
        log_message = json.dumps(log_data)
        sock = socket(AF_INET, SOCK_STREAM)
        sock.connect((logstash_host, logstash_port))
        sock.sendall(log_message.encode('utf-8'))
        sock.close()

    # Función para generar un log aleatorio
    def generate_dummy_log():
        log_levels = ["INFO", "WARNING", "ERROR", "DEBUG"]
        messages = [
            "User logged in",
            "User logged out",
            "Error accessing database",
            "Page not found",
            "New order created",
            "Order failed",
        ]
        user_ids = range(1, 101)  # Simulación de 100 usuarios

        log = {
            "timestamp": datetime.utcnow().strftime('%Y-%m-%dT%H:%M:%S.%fZ'),
            "level": random.choice(log_levels),
            "message": random.choice(messages),
            "user_id": random.choice(user_ids)
        }
        return log

    # Generar y enviar logs continuamente
    try:
        while True:
            log_data = generate_dummy_log()
            send_log(log_data)
            print(f"Sent log: {log_data}")
            time.sleep(random.uniform(0.5, 2.0))  # Enviar un log cada 0.5 a 2 segundos
    except KeyboardInterrupt:
        print("Log generation stopped.")
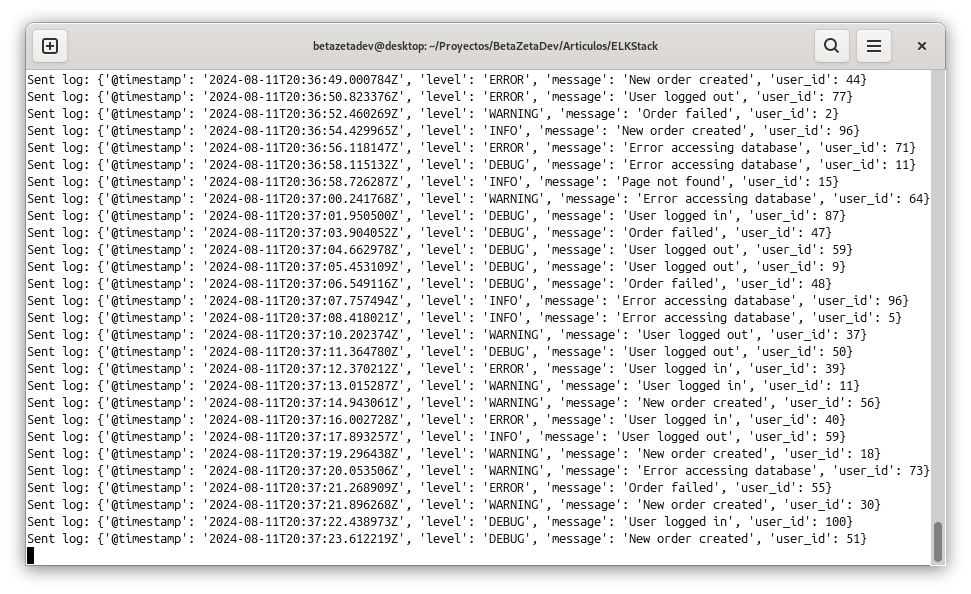
With this script, we will generate random logs and send them to Logstash via port 5044. To run it, we only need to have Python installed on our machine and execute it with the following command:
python log_generator.py
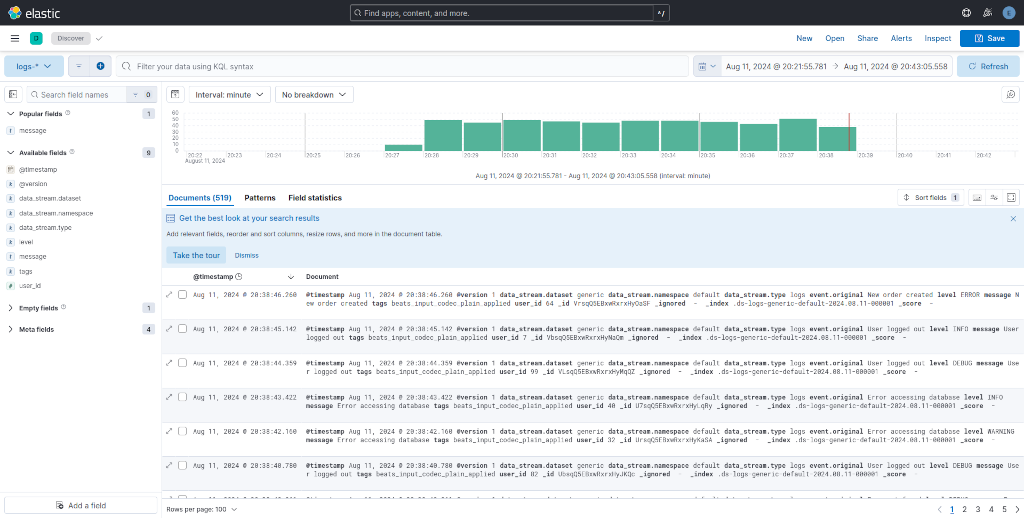
Once the script is running, we can view the generated logs in Kibana by accessing the Discover section within Analytics. From there, we can search, filter, and visualize the logs in real-time. From this point, we can create custom dashboards, configure alerts, and perform advanced analyses of the generated data.
But that is a topic for another article. For now, we have seen how to install and configure a basic ELK environment and send logs through Logstash—a solid foundation to start exploring the capabilities of this advanced monitoring suite.
I hope this article has been helpful and that your knowledge toolbox is now a bit fuller. Remember that this is a testing configuration and not suitable for production, so if you want to deploy ELK in a production environment, I recommend following the best security and performance practices. You can find all the necessary information in the official documentation.
That may interest you
Flutter is a mobile app development framework created by Google that has gained popularity for its …
read moreWorking in software can quickly turn into a maze of tasks, branches, and bugs waiting to be …
read moreIn the previous chapter, we reviewed the origins and fundamentals of databases. We took a brief …
read more